ℹ️ Skipped - page is already crawled
| Filter | Status | Condition | Details |
|---|---|---|---|
| HTTP status | PASS | download_http_code = 200 | HTTP 200 |
| Age cutoff | PASS | download_stamp > now() - 6 MONTH | 0 months ago |
| History drop | PASS | isNull(history_drop_reason) | No drop reason |
| Spam/ban | PASS | fh_dont_index != 1 AND ml_spam_score = 0 | ml_spam_score=0 |
| Canonical | PASS | meta_canonical IS NULL OR = '' OR = src_unparsed | Not set |
| Property | Value |
|---|---|
| URL | https://www.warriortrading.com/bollinger-bands-definition-day-trading-terminology/ |
| Last Crawled | 2026-04-12 23:54:41 (1 day ago) |
| First Indexed | 2017-01-27 14:09:15 (9 years ago) |
| HTTP Status Code | 200 |
| Meta Title | Bollinger Bands Strategy: What They Are & How To Use Them |
| Meta Description | Learn how I use the Bollinger Bands strategy to spot reversals, time entries, and stay one step ahead of false breakouts in day trading. |
| Meta Canonical | null |
| Boilerpipe Text | What Are Bollinger Bands?
How I Use Bollinger Bands in Day Trading
Price Outside the Bands = Reversal Risk
Don’t Act on the First Candle — Wait for Confirmation
Why I Pair Bollinger Bands With the 9 EMA
Live Trade Example: CTMX & P Stock
When Not To Use Bollinger Bands
My Favorite Indicators To Pair With Bollinger Bands
Final Thoughts: Mastering the Bollinger Bands Strategy
Watch Full Video Here:
Bollinger Bands: Why Millionaire Traders Are Using This Technical Indicator
When I first started using
Bollinger Bands
, I realized they were more than just lines on a chart. These bands — simple as they look — can give you a powerful edge in reading
price action
, especially when you know what to look for.
In this article, I’m breaking down exactly how I use the Bollinger Bands strategy in my day trading, how I combine them with other indicators, and the specific signals I look for when a reversal is coming.
Let’s dive in.
What Are Bollinger Bands?
Bollinger Bands are a type of
technical indicato
r that helps visualize volatility. They’re made up of three components: a
simple moving averag
e in the middle (usually a
20-period SMA
), and two bands above and below that line, placed at a standard deviation (typically 2). The outer bands expand and contract based on price volatility.
I keep the default settings. If you tweak them too much, you’re not seeing what other traders are seeing, and that’s a problem. In this business, I want to be reacting to what the majority is watching.
If you change them from what everyone else is using, you’re going to see different buy and sell signals.
So, default settings. Always.
How I Use Bollinger Bands in Day Trading
This indicator isn’t something I rely on by itself. But when I combine it with price action, volume, and a couple of other indicators, it becomes incredibly useful, especially for spotting reversals.
Price Outside the Bands = Reversal Risk
Whenever I see a candle fully outside the upper or lower Bollinger Band, that’s my first signal. It’s not a guarantee, but it tells me we’re stretched.
Nearly 95% of the price action during the day will occur inside the Bollinger bands.
So when we’re outside, that’s a sign we’re reaching an extreme.
That’s when I start preparing for a possible
reversal
. But — and this is important — I don’t act on the first candle alone.
Don’t Act on the First Candle — Wait for Confirmation
Just because a candle is outside the band doesn’t mean I’m jumping in. What I look for next is confirmation: usually a topping tail, a
doji
, or a candle with a small body and a long wick. The actual entry happens on the next candle when it breaks the low of that signal bar.
Your stop? It’s always at the high of the day.
The best setups have that clear structure.
The confirmation is then when the next candle breaks the low and your stop is always at the high of day.
Why I Pair Bollinger Bands With the 9 EMA
I rarely trade off Bollinger Bands alone. One of the best companion indicators is the 9 EMA. If the price is extended outside the Bollinger Bands and it’s well off the 9 EMA, that’s a red flag for overextension.
When price is extended off the 9 EMA and outside the bands, I’m watching for the rug to get pulled. It increases the odds of a false breakout, especially when the
MACD
is starting to curl against the move.
Live Trade Example: CTMX & P Stock
Let me show you how this played out with a couple of stocks I watched and traded recently: CTMX and ticker P.
CTMX was up about 200% on the news. We saw a strong move, a small pullback, and then another push higher. Then came the topping tail candle — fully outside the upper band. The volume was high, the MACD was curling, and we were way above the 9 EMA.
That was my cue.
Same thing with P. We got an initial breakout, and then the next candle was red and completely outside the bands. That told me a pullback was likely. And sure enough, it came back to the 9 EMA, then to the 20 EMA, and eventually to
VWAP
.
It’s about recognizing when we’re extended and knowing that most of the time, we’ll snap back like a stretched rubber band.
When Not To Use Bollinger Bands
There are situations where Bollinger Bands aren’t all that helpful. Here’s when I typically avoid using them:
Bands are too compressed:
When the upper and lower bands are tight, it usually means the stock is in a
consolidation phase
. That can lead to choppy, sideways movement, and I don’t want to get caught in a fake breakout.
Low volume: I
f there’s no volume behind the move, I don’t trust the setup. Volume is key for confirming price action.
MACD is flat or curling against you:
If momentum isn’t lining up, that’s a big red flag.
Too many indicators on your chart:
This one’s a big deal. If you overload your screen with 10+ indicators, it becomes hard to see what really matters. That’s how you fall into analysis paralysis.
If you have 25 indicators that you have to review every time before you take a trade, you’re going to start getting conflicting signals.
Keep it clean. Keep it simple.
My Favorite Indicators To Pair With Bollinger Bands
If you’ve watched my videos, you know I like clean charts. Here’s what I use with Bollinger Bands:
9 EMA:
short-term support/resistance
20 EMA:
second layer of confirmation
MACD:
shows momentum shifts and crossovers
VWAP:
helps me gauge overall strength or weakness
Candlestick patterns:
especially dojis and topping tails
You don’t need a hundred indicators — I trade with 4 or 5, max.
Final Thoughts: Mastering the Bollinger Bands Strategy
To get good with Bollinger Bands, you need to watch how price behaves around them in real time. Focus on reversals when candles stretch outside the bands. Look for confirmation. Pair them with the 9 EMA and MACD.
And don’t overcomplicate your charts. The best traders keep it clean and trust what the indicators — and volume — are telling them.
The more screen time you log, the more second nature this all becomes.
If you want to dive deeper into strategies like this, check out my
live trading classes
and
tools
at Warrior Trading — that’s where I teach it all in real time. |
| Markdown | 
[](https://www.warriortrading.com/)
- [](https://www.warriortrading.com/)
- [Products + Services]()
- - - [Introductory Specials]()
- [Free Webinar](https://www.warriortrading.com/free-day-trading-class/)
- [Pro Preview Two-Week Trial](https://www.warriortrading.com/pro-preview-trial/)
- [About Warrior Pro](https://www.warriortrading.com/warrior-pro-info/)
- - [Trading Courses & Memberships]()
- [Warrior Starter](https://www.warriortrading.com/warrior-starter-info/)
- [Warrior Pro](https://www.warriortrading.com/warrior-pro-info/)
- [Warrior Pro Bundle - BEST VALUE\!](https://www.warriortrading.com/warrior-pro-info/)
- [Compare Memberships](https://www.warriortrading.com/memberships/)
- [Trading Course Library](https://www.warriortrading.com/trading-courses/)
- - [Tools & Software]()
- [Day Trade Dash Software](https://www.warriortrading.com/day-trade-dash/)
- [Real-Time Trading Simulator](https://www.warriortrading.com/paper-trading/)
- [Live Chat Room & Stream](https://www.warriortrading.com/day-trading-chat-room/)
- [Compare Software](https://www.warriortrading.com/day-trading-software/)
- [Resources]()
- - - [Strategies]()
- [Momentum Trading](https://www.warriortrading.com/momentum-day-trading-strategy/)
- [Penny Stocks](https://www.warriortrading.com/penny-stocks/)
- [Gap and Go](https://www.warriortrading.com/gap-go/)
- [Bull Flag Patterns](https://www.warriortrading.com/bull-flag-trading/)
- - [Guides]()
- [How much money do you need to day trade?](https://www.warriortrading.com/how-much-money-do-you-need-to-day-trade/)
- [Day Trading Guide](https://www.warriortrading.com/day-trading/)
- [Small Account Guide](https://www.warriortrading.com/small-account-guide/)
- [Stock Broker Guide](https://www.warriortrading.com/stock-broker-essential-guide/)
- [Stock Order Types Guide](https://www.warriortrading.com/stock-order-types/)
- [Technical Analysis Guide](https://www.warriortrading.com/technical-analysis/)
- [Trading Computer Guide](https://www.warriortrading.com/day-trading-computer/)
- [Trading Terms Guide](https://www.warriortrading.com/day-trading-terminology/)
- - [How To's]()
- [How to Day Trade Without \$25k](https://www.warriortrading.com/how-to-day-trade-without-25k/)
- [How to Make a Living Day Trading](https://www.warriortrading.com/how-to-make-a-living-day-trading/)
- [How to Get Around PDT](https://www.warriortrading.com/how-to-get-around-the-pdt-rule/)
- [How to Use Multiple Time Frames](https://www.warriortrading.com/technical-analysis-using-multiple-timeframes/)
- [How to Use Scanners](https://www.warriortrading.com/how-to-use-stock-scanners/)
- [How to Short Stocks](https://www.warriortrading.com/how-to-short-stocks/)
- [Understanding Taxes for Day Traders](https://www.warriortrading.com/day-trading-taxes/)
- [How to Read Stock Charts](https://www.warriortrading.com/how-to-read-stock-charts-for-beginners/)
- - [Day Trading Resources]()
- [Broker & Platform Reviews](https://www.warriortrading.com/best-online-stock-brokers/)
- ["Best Of" Day Trading Tools Review](https://www.warriortrading.com/the-5-best-tools-for-day-trading/)
- [Stock Quotes Data Feed](https://www.warriortrading.com/quote/)
- [About]()
- - - [About Ross]()
- [Ross's Biography](https://www.warriortrading.com/ross-cameron/)
- [About Warrior Trading](https://www.warriortrading.com/legitimacy/)
- [Ross's Verified Earnings (2017-2026)](https://www.warriortrading.com/ross-camerons-verified-day-trading-earnings/)
- [RossCameron.com](https://www.rosscameron.com/)
- - [Member Stories]()
- [Member Reviews](https://www.warriortrading.com/reviews/)
- [All Star Traders](https://www.warriortrading.com/all-star-traders/)
- [Success Stories](https://www.warriortrading.com/warrior-pro-info/success-stories/)
- [Student Interviews](https://www.warriortrading.com/day-trader-stories/)
- - [Contact Us]()
- [Support Portal](https://support.warriortrading.com/support/home/)
- [Contact Us](https://support.warriortrading.com/support/home/)
- [Performance Disclosure](https://www.warriortrading.com/ross-camerons-verified-day-trading-earnings/)
- [Charitable Giving](https://www.warriortrading.com/charitable-giving/)
- - [More]()
- [Warrior Trading Merch](https://merch.warriortrading.com/)
- [FAQ](https://www.warriortrading.com/faq)
- [Books](https://www.warriortrading.com/books/how-to-day-trade/)
- [](https://www.warriortrading.com/memberships/)
- [](https://www.warriortrading.com/watch-now/)
- - - - - [Sign in](https://www.warriortrading.com/login-member)
- [Members]()
- - - [Member Access]()
- [Sign in](https://www.warriortrading.com/login-member)
Trading is risky, and most day traders lose money. Ross's [results](https://www.warriortrading.com/ross-camerons-verified-day-trading-earnings/) are not typical. All information provided is for educational purposes and is not investment advice or buy/sell recommendations. Read our [full disclaimer](https://www.warriortrading.com/disclaimer/).
Technical Analysis Guide
## Technical Analysis Guide
- [Technical Analysis Guide](https://www.warriortrading.com/bollinger-bands-definition-day-trading-terminology/)
- [Technical Analysis Guide](https://www.warriortrading.com/technical-analysis/)
- [Best Continuation Patterns](https://www.warriortrading.com/continuation-patterns/)
- [Best Trading Patterns](https://www.warriortrading.com/best-day-trading-patterns/)
- [Technical Analysis Software](https://www.warriortrading.com/best-technical-analysis-software/)
- [Top Books](https://www.warriortrading.com/best-technical-analysis-books/)
- [Best Momentum Indicators](https://www.warriortrading.com/best-momentum-indicators/)
- [Technical Analysis Indicators](https://www.warriortrading.com/bollinger-bands-definition-day-trading-terminology/)
- [Bollinger Bands](https://www.warriortrading.com/bollinger-bands-definition-day-trading-terminology/)
- [EMA](https://www.warriortrading.com/exponential-moving-average/)
- [Fibonacci](https://www.warriortrading.com/fibonacci-retracement-definition/)
- [MACD](https://www.warriortrading.com/moving-average-convergence-divergence-macd-definition-day-trading-terminology/)
- [RSI](https://www.warriortrading.com/relative-strength-index-rsi-definition-day-trading-terminology/)
- [SMA](https://www.warriortrading.com/simple-moving-average/)
- [Stochastics](https://www.warriortrading.com/stochastic-oscillator-day-trading-terminology/)
- [TWAP](https://www.warriortrading.com/time-weighted-average-price-indicator-twap/)
- [Volume](https://www.warriortrading.com/volume-definition-day-trading-terminology/)
- [VWAP](https://www.warriortrading.com/vwap/)
- [Technical Analysis Patterns](https://www.warriortrading.com/bollinger-bands-definition-day-trading-terminology/)
- [Consolidation](https://www.warriortrading.com/stock-consolidation/)
- [Cup and Handle](https://www.warriortrading.com/cup-handle-definition/)
- [Death Cross](https://www.warriortrading.com/death-cross-definition-day-trading-terminology/)
- [Double Top](https://www.warriortrading.com/double-top-reversal-day-trading-terminology/)
- [Engulfing](https://www.warriortrading.com/bullish-engulfing-pattern-day-trading-terminology/)
- [Flag Patterns](https://www.warriortrading.com/flag-pennant-pattern-definition-day-trading-terminology/)
- [Head and Shoulder](https://www.warriortrading.com/head-shoulder-definition-day-trading-terminology/)
- [Support/Resistance](https://www.warriortrading.com/support-and-resistance/)
- [Trendlines](https://www.warriortrading.com/trendlines/)
- [Pennant](https://www.warriortrading.com/pennant-pattern/)
- [Shooting Star](https://www.warriortrading.com/shooting-star-pattern/)
- [Double Bottom](https://www.warriortrading.com/double-bottom-pattern/)
- [Ascending Triangle](https://www.warriortrading.com/ascending-triangle-pattern/)
# Bollinger Bands Strategy: What They Are & How To Use Them

Table of contents
- [What Are Bollinger Bands?](https://www.warriortrading.com/bollinger-bands-definition-day-trading-terminology/#h3smh3njaj41sqfw7r15ieyahh79pxe)
- [How I Use Bollinger Bands in Day Trading](https://www.warriortrading.com/bollinger-bands-definition-day-trading-terminology/#h13smh3njdpa1oqbnatjdtst2gmelop)
- [Price Outside the Bands = Reversal Risk](https://www.warriortrading.com/bollinger-bands-definition-day-trading-terminology/#h22smh3njh8p149sunr595q2w1yxizug)
- [Don’t Act on the First Candle — Wait for Confirmation](https://www.warriortrading.com/bollinger-bands-definition-day-trading-terminology/#h30smh3njl6hvrjw9n1vit7iagi2b91)
- [Why I Pair Bollinger Bands With the 9 EMA](https://www.warriortrading.com/bollinger-bands-definition-day-trading-terminology/#h37smh3njon81c6esov1ymhoze20xgo9)
- [Live Trade Example: CTMX & P Stock](https://www.warriortrading.com/bollinger-bands-definition-day-trading-terminology/#h43smh3njsf1m7sim5eapwb4hp2z08)
- [When Not To Use Bollinger Bands](https://www.warriortrading.com/bollinger-bands-definition-day-trading-terminology/#h48smh3nk05k7lj80gw34mja8veams)
- [My Favorite Indicators To Pair With Bollinger Bands](https://www.warriortrading.com/bollinger-bands-definition-day-trading-terminology/#h52smh3nk41qxo6n4y15dx4sm4s2pyz)
- [Final Thoughts: Mastering the Bollinger Bands Strategy](https://www.warriortrading.com/bollinger-bands-definition-day-trading-terminology/#h55smh3nk7yg14nz6mr14davd31roc6h8)
Watch Full Video Here: [Bollinger Bands: Why Millionaire Traders Are Using This Technical Indicator](https://youtu.be/DgWn3egDGb0?si=aliRBr5KR6e-eaY0)
When I first started using [Bollinger Bands](https://www.investopedia.com/terms/b/bollingerbands.asp), I realized they were more than just lines on a chart. These bands — simple as they look — can give you a powerful edge in reading [price action](https://www.warriortrading.com/price-action-definition-day-trading-terminology/), especially when you know what to look for.
In this article, I’m breaking down exactly how I use the Bollinger Bands strategy in my day trading, how I combine them with other indicators, and the specific signals I look for when a reversal is coming.
Let’s dive in.
## **What Are Bollinger Bands?**
Bollinger Bands are a type of [technical indicato](https://www.warriortrading.com/top-4-indicators-day-trading/)r that helps visualize volatility. They’re made up of three components: a [simple moving averag](https://www.warriortrading.com/simple-moving-average/)e in the middle (usually a [20-period SMA](https://www.investopedia.com/terms/s/sma.asp)), and two bands above and below that line, placed at a standard deviation (typically 2). The outer bands expand and contract based on price volatility.
[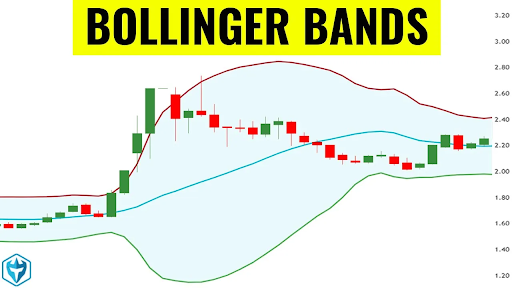](https://media.warriortrading.com/2017/01/23124650/unnamed-21.png)
I keep the default settings. If you tweak them too much, you’re not seeing what other traders are seeing, and that’s a problem. In this business, I want to be reacting to what the majority is watching. **If you change them from what everyone else is using, you’re going to see different buy and sell signals.**
So, default settings. Always.
## **How I Use Bollinger Bands in Day Trading**
This indicator isn’t something I rely on by itself. But when I combine it with price action, volume, and a couple of other indicators, it becomes incredibly useful, especially for spotting reversals.
### **Price Outside the Bands = Reversal Risk**
Whenever I see a candle fully outside the upper or lower Bollinger Band, that’s my first signal. It’s not a guarantee, but it tells me we’re stretched.
**Nearly 95% of the price action during the day will occur inside the Bollinger bands.** So when we’re outside, that’s a sign we’re reaching an extreme.
That’s when I start preparing for a possible [reversal](https://www.warriortrading.com/reversal-definition-day-trading-terminology/). But — and this is important — I don’t act on the first candle alone.
### **Don’t Act on the First Candle — Wait for Confirmation**
Just because a candle is outside the band doesn’t mean I’m jumping in. What I look for next is confirmation: usually a topping tail, a [doji](https://www.warriortrading.com/doji-candle-definition-day-trading-terminology/), or a candle with a small body and a long wick. The actual entry happens on the next candle when it breaks the low of that signal bar.
Your stop? It’s always at the high of the day.
The best setups have that clear structure. **The confirmation is then when the next candle breaks the low and your stop is always at the high of day.**
### **Why I Pair Bollinger Bands With the 9 EMA**
I rarely trade off Bollinger Bands alone. One of the best companion indicators is the 9 EMA. If the price is extended outside the Bollinger Bands and it’s well off the 9 EMA, that’s a red flag for overextension.
When price is extended off the 9 EMA and outside the bands, I’m watching for the rug to get pulled. It increases the odds of a false breakout, especially when the [MACD](https://www.warriortrading.com/how-traders-use-the-macd/) is starting to curl against the move.
## **Live Trade Example: CTMX & P Stock**
Let me show you how this played out with a couple of stocks I watched and traded recently: CTMX and ticker P.
CTMX was up about 200% on the news. We saw a strong move, a small pullback, and then another push higher. Then came the topping tail candle — fully outside the upper band. The volume was high, the MACD was curling, and we were way above the 9 EMA.
[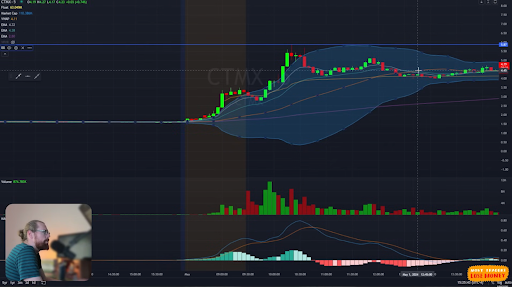](https://media.warriortrading.com/2017/01/23124701/unnamed-20.png)
That was my cue.
Same thing with P. We got an initial breakout, and then the next candle was red and completely outside the bands. That told me a pullback was likely. And sure enough, it came back to the 9 EMA, then to the 20 EMA, and eventually to [VWAP](https://www.warriortrading.com/vwap/).
It’s about recognizing when we’re extended and knowing that most of the time, we’ll snap back like a stretched rubber band.
## **When Not To Use Bollinger Bands**
There are situations where Bollinger Bands aren’t all that helpful. Here’s when I typically avoid using them:
- **Bands are too compressed:** When the upper and lower bands are tight, it usually means the stock is in a [consolidation phase](https://www.investopedia.com/terms/c/consolidation.asp). That can lead to choppy, sideways movement, and I don’t want to get caught in a fake breakout.
- **Low volume: I** f there’s no volume behind the move, I don’t trust the setup. Volume is key for confirming price action.
- **MACD is flat or curling against you:** If momentum isn’t lining up, that’s a big red flag.
- **Too many indicators on your chart:** This one’s a big deal. If you overload your screen with 10+ indicators, it becomes hard to see what really matters. That’s how you fall into analysis paralysis.
**If you have 25 indicators that you have to review every time before you take a trade, you’re going to start getting conflicting signals.**
Keep it clean. Keep it simple.
## **My Favorite Indicators To Pair With Bollinger Bands**
If you’ve watched my videos, you know I like clean charts. Here’s what I use with Bollinger Bands:
- **9 EMA:** short-term support/resistance
- **20 EMA:** second layer of confirmation
- **MACD:** shows momentum shifts and crossovers
- **VWAP:** helps me gauge overall strength or weakness
- **Candlestick patterns:** especially dojis and topping tails
You don’t need a hundred indicators — I trade with 4 or 5, max.
## **Final Thoughts: Mastering the Bollinger Bands Strategy**
To get good with Bollinger Bands, you need to watch how price behaves around them in real time. Focus on reversals when candles stretch outside the bands. Look for confirmation. Pair them with the 9 EMA and MACD.
And don’t overcomplicate your charts. The best traders keep it clean and trust what the indicators — and volume — are telling them.
The more screen time you log, the more second nature this all becomes.
If you want to dive deeper into strategies like this, check out my [live trading classes](https://www.warriortrading.com/trading-courses/) and [tools](https://www.warriortrading.com/the-5-best-tools-for-day-trading/) at Warrior Trading — that’s where I teach it all in real time.
[](https://www.warriortrading.com/free-day-trading-class/)
[](https://www.warriortrading.com/ultimate-beginner-day-trading-kit/)
[](https://www.youtube.com/@DaytradeWarrior)[](https://twitter.com/WarriorTrading)[](https://www.instagram.com/warriortrading/)[](https://www.linkedin.com/company/warrior-trading)[](https://www.crunchbase.com/organization/warrior-trading)[](https://www.tiktok.com/@warriortradingofficial)[](https://medium.com/@WarriorTrading)
### Sign Up for our Newsletter
Keep up with Ross's day trading insights
Quick Links
[Free Webinar](https://www.warriortrading.com/free-day-trading-class/)[Pro Preview Two-Week Trial](https://www.warriortrading.com/pro-preview-trial/)[Warrior Pro](https://www.warriortrading.com/warrior-pro-info/)[Day Trade Dash Software](https://www.warriortrading.com/day-trade-dash/)[Chat Room](https://www.warriortrading.com/day-trading-chat-room/)[Simulator](https://www.warriortrading.com/paper-trading/)[Compare Memberships](https://www.warriortrading.com/memberships/)
About
[About Warrior Trading](https://www.warriortrading.com/legitimacy/)[Ross's Biography](https://www.warriortrading.com/ross-cameron/)[Ross's Verified Earnings (2017–2025)](https://www.warriortrading.com/ross-camerons-verified-day-trading-earnings/)[Member Reviews](https://www.warriortrading.com/reviews/)[Student Interviews](https://www.warriortrading.com/day-trader-stories/)[Careers](https://www.warriortrading.com/careers/)[Contact](https://support.warriortrading.com/support/tickets/new?ticket_form=contact_support)[Support Portal](https://support.warriortrading.com/support/home)
Policies
[Disclaimer, Terms & Conditions, Refund Policy](https://www.warriortrading.com/disclaimer/)[Privacy Policy](https://www.warriortrading.com/privacy-policy/)
Do Not Sell or Share My Personal Information
Billing & General Support
**Contact Email:**
[team@warriortrading.com](mailto:team@warriortrading.com)
**Mailing Address:**
Warrior Trading
PO Box 330
Great Barrington, MA 01230
If you do not agree with any term or provision of our Terms and Conditions you should not use our Site, Services, Content or Information. Please be advised that your continued use of the Site, Services, Content, or Information provided shall indicate your consent and agreement to our Terms and Conditions.
Warrior Trading may publish testimonials or descriptions of past performance but these results are NOT typical, are not indicative of future results or performance, and are not intended to be a representation, warranty or guarantee that similar results will be obtained by you. Profit figures may represent gross or net gains. Gross profits reflect trading performance prior to the deduction of transaction costs. These figures do not include the impact of commissions, taxes, margin interest, or other brokerage fees.
Ross Cameron’s experience with trading is not typical, nor is the experience of traders featured in testimonials. They are experienced traders. Becoming an experienced trader takes hard work, dedication and a significant amount of time.
Your results may differ materially from those expressed or utilized by Warrior Trading due to a number of factors. We do not track the typical results of our past or current customers. As a provider of educational courses, we do not have access to the personal trading accounts or brokerage statements of our customers. As a result, we have no reason to believe our customers perform better or worse than traders as a whole.
Available research data suggests that most day traders are NOT profitable.
In a research paper published in 2014 titled “Do Day Traders Rationally Learn About Their Ability?”, professors from the University of California studied 3.7 billion trades from the Taiwan Stock Exchange between 1992-2006 and found that only 9.81% of day trading volume was generated by predictably profitable traders and that these predictably profitable traders constitute less than 3% of all day traders on an average day.
In a 2005 article published in the Journal of Applied Finance titled “The Profitability of Active Stock Traders” professors at the University of Oxford and the University College Dublin found that out of 1,146 brokerage accounts day trading the U.S. markets between March 8, 2000 and June 13, 2000, only 50% were profitable with an average net profit of \$16,619.
In a 2003 article published in the Financial Analysts Journal titled “The Profitability of Day Traders”, professors at the University of Texas found that out of 334 brokerage accounts day trading the U.S. markets between February 1998 and October 1999, only 35% were profitable and only 14% generated profits in excess of \$10,000.
The range of results in these three studies exemplify the challenge of determining a definitive success rate for day traders. At a minimum, these studies indicate at least 50% of aspiring day traders will not be profitable. This reiterates that consistently making money trading stocks is not easy. Day Trading is a high risk activity and can result in the loss of your entire investment. Any trade or investment is at your own risk.
Any and all information discussed is for educational and informational purposes only and should not be considered tax, legal or investment advice. A referral to a stock or commodity is not an indication to buy or sell that stock or commodity.
Data, content and information presented or available within the Scanner, Charts, and Simulator is provided to us by third-party providers. Warrior Trading does not guarantee the validity, adequacy, timeliness, accuracy, reliability, completeness or usefulness of, such data, content or information.
This does not represent our full Disclaimer. Please read our [complete disclaimer](https://www.warriortrading.com/disclaimer/).
**Citations for Disclaimer**
Barber, Brad & Lee, Yong-Ill & Liu, Yu-Jane & Odean, Terrance. (2014). Do Day Traders Rationally Learn About Their Ability?. SSRN Electronic Journal. <https://papers.ssrn.com/sol3/papers.cfm?abstract_id=2535636>
Garvey, Ryan and Murphy, Anthony, The Profitability of Active Stock Traders. Journal of Applied Finance , Vol. 15, No. 2, Fall/Winter 2005. Available at SSRN: <https://ssrn.com/abstract=908615>
Douglas J. Jordan & J. David Diltz (2003) The Profitability of Day Traders, Financial Analysts Journal, 59:6, 85-94, DOI: <https://www.tandfonline.com/doi/abs/10.2469/faj.v59.n6.2578>

Copyright © 2026 Warrior Trading™ All rights reserved.
 |
| Readable Markdown | - [What Are Bollinger Bands?](https://www.warriortrading.com/bollinger-bands-definition-day-trading-terminology/#h3smh3njaj41sqfw7r15ieyahh79pxe)
- [How I Use Bollinger Bands in Day Trading](https://www.warriortrading.com/bollinger-bands-definition-day-trading-terminology/#h13smh3njdpa1oqbnatjdtst2gmelop)
- [Price Outside the Bands = Reversal Risk](https://www.warriortrading.com/bollinger-bands-definition-day-trading-terminology/#h22smh3njh8p149sunr595q2w1yxizug)
- [Don’t Act on the First Candle — Wait for Confirmation](https://www.warriortrading.com/bollinger-bands-definition-day-trading-terminology/#h30smh3njl6hvrjw9n1vit7iagi2b91)
- [Why I Pair Bollinger Bands With the 9 EMA](https://www.warriortrading.com/bollinger-bands-definition-day-trading-terminology/#h37smh3njon81c6esov1ymhoze20xgo9)
- [Live Trade Example: CTMX & P Stock](https://www.warriortrading.com/bollinger-bands-definition-day-trading-terminology/#h43smh3njsf1m7sim5eapwb4hp2z08)
- [When Not To Use Bollinger Bands](https://www.warriortrading.com/bollinger-bands-definition-day-trading-terminology/#h48smh3nk05k7lj80gw34mja8veams)
- [My Favorite Indicators To Pair With Bollinger Bands](https://www.warriortrading.com/bollinger-bands-definition-day-trading-terminology/#h52smh3nk41qxo6n4y15dx4sm4s2pyz)
- [Final Thoughts: Mastering the Bollinger Bands Strategy](https://www.warriortrading.com/bollinger-bands-definition-day-trading-terminology/#h55smh3nk7yg14nz6mr14davd31roc6h8)
Watch Full Video Here: [Bollinger Bands: Why Millionaire Traders Are Using This Technical Indicator](https://youtu.be/DgWn3egDGb0?si=aliRBr5KR6e-eaY0)
When I first started using [Bollinger Bands](https://www.investopedia.com/terms/b/bollingerbands.asp), I realized they were more than just lines on a chart. These bands — simple as they look — can give you a powerful edge in reading [price action](https://www.warriortrading.com/price-action-definition-day-trading-terminology/), especially when you know what to look for.
In this article, I’m breaking down exactly how I use the Bollinger Bands strategy in my day trading, how I combine them with other indicators, and the specific signals I look for when a reversal is coming.
Let’s dive in.
## **What Are Bollinger Bands?**
Bollinger Bands are a type of [technical indicato](https://www.warriortrading.com/top-4-indicators-day-trading/)r that helps visualize volatility. They’re made up of three components: a [simple moving averag](https://www.warriortrading.com/simple-moving-average/)e in the middle (usually a [20-period SMA](https://www.investopedia.com/terms/s/sma.asp)), and two bands above and below that line, placed at a standard deviation (typically 2). The outer bands expand and contract based on price volatility.
[](https://media.warriortrading.com/2017/01/23124650/unnamed-21.png)
I keep the default settings. If you tweak them too much, you’re not seeing what other traders are seeing, and that’s a problem. In this business, I want to be reacting to what the majority is watching. **If you change them from what everyone else is using, you’re going to see different buy and sell signals.**
So, default settings. Always.
## **How I Use Bollinger Bands in Day Trading**
This indicator isn’t something I rely on by itself. But when I combine it with price action, volume, and a couple of other indicators, it becomes incredibly useful, especially for spotting reversals.
### **Price Outside the Bands = Reversal Risk**
Whenever I see a candle fully outside the upper or lower Bollinger Band, that’s my first signal. It’s not a guarantee, but it tells me we’re stretched.
**Nearly 95% of the price action during the day will occur inside the Bollinger bands.** So when we’re outside, that’s a sign we’re reaching an extreme.
That’s when I start preparing for a possible [reversal](https://www.warriortrading.com/reversal-definition-day-trading-terminology/). But — and this is important — I don’t act on the first candle alone.
### **Don’t Act on the First Candle — Wait for Confirmation**
Just because a candle is outside the band doesn’t mean I’m jumping in. What I look for next is confirmation: usually a topping tail, a [doji](https://www.warriortrading.com/doji-candle-definition-day-trading-terminology/), or a candle with a small body and a long wick. The actual entry happens on the next candle when it breaks the low of that signal bar.
Your stop? It’s always at the high of the day.
The best setups have that clear structure. **The confirmation is then when the next candle breaks the low and your stop is always at the high of day.**
### **Why I Pair Bollinger Bands With the 9 EMA**
I rarely trade off Bollinger Bands alone. One of the best companion indicators is the 9 EMA. If the price is extended outside the Bollinger Bands and it’s well off the 9 EMA, that’s a red flag for overextension.
When price is extended off the 9 EMA and outside the bands, I’m watching for the rug to get pulled. It increases the odds of a false breakout, especially when the [MACD](https://www.warriortrading.com/how-traders-use-the-macd/) is starting to curl against the move.
## **Live Trade Example: CTMX & P Stock**
Let me show you how this played out with a couple of stocks I watched and traded recently: CTMX and ticker P.
CTMX was up about 200% on the news. We saw a strong move, a small pullback, and then another push higher. Then came the topping tail candle — fully outside the upper band. The volume was high, the MACD was curling, and we were way above the 9 EMA.
[](https://media.warriortrading.com/2017/01/23124701/unnamed-20.png)
That was my cue.
Same thing with P. We got an initial breakout, and then the next candle was red and completely outside the bands. That told me a pullback was likely. And sure enough, it came back to the 9 EMA, then to the 20 EMA, and eventually to [VWAP](https://www.warriortrading.com/vwap/).
It’s about recognizing when we’re extended and knowing that most of the time, we’ll snap back like a stretched rubber band.
## **When Not To Use Bollinger Bands**
There are situations where Bollinger Bands aren’t all that helpful. Here’s when I typically avoid using them:
- **Bands are too compressed:** When the upper and lower bands are tight, it usually means the stock is in a [consolidation phase](https://www.investopedia.com/terms/c/consolidation.asp). That can lead to choppy, sideways movement, and I don’t want to get caught in a fake breakout.
- **Low volume: I** f there’s no volume behind the move, I don’t trust the setup. Volume is key for confirming price action.
- **MACD is flat or curling against you:** If momentum isn’t lining up, that’s a big red flag.
- **Too many indicators on your chart:** This one’s a big deal. If you overload your screen with 10+ indicators, it becomes hard to see what really matters. That’s how you fall into analysis paralysis.
**If you have 25 indicators that you have to review every time before you take a trade, you’re going to start getting conflicting signals.**
Keep it clean. Keep it simple.
## **My Favorite Indicators To Pair With Bollinger Bands**
If you’ve watched my videos, you know I like clean charts. Here’s what I use with Bollinger Bands:
- **9 EMA:** short-term support/resistance
- **20 EMA:** second layer of confirmation
- **MACD:** shows momentum shifts and crossovers
- **VWAP:** helps me gauge overall strength or weakness
- **Candlestick patterns:** especially dojis and topping tails
You don’t need a hundred indicators — I trade with 4 or 5, max.
## **Final Thoughts: Mastering the Bollinger Bands Strategy**
To get good with Bollinger Bands, you need to watch how price behaves around them in real time. Focus on reversals when candles stretch outside the bands. Look for confirmation. Pair them with the 9 EMA and MACD.
And don’t overcomplicate your charts. The best traders keep it clean and trust what the indicators — and volume — are telling them.
The more screen time you log, the more second nature this all becomes.
If you want to dive deeper into strategies like this, check out my [live trading classes](https://www.warriortrading.com/trading-courses/) and [tools](https://www.warriortrading.com/the-5-best-tools-for-day-trading/) at Warrior Trading — that’s where I teach it all in real time. |
| Shard | 43 (laksa) |
| Root Hash | 598809389528988043 |
| Unparsed URL | com,warriortrading!www,/bollinger-bands-definition-day-trading-terminology/ s443 |