ℹ️ Skipped - page is already crawled
| Filter | Status | Condition | Details |
|---|---|---|---|
| HTTP status | PASS | download_http_code = 200 | HTTP 200 |
| Age cutoff | PASS | download_stamp > now() - 6 MONTH | 0.1 months ago |
| History drop | PASS | isNull(history_drop_reason) | No drop reason |
| Spam/ban | PASS | fh_dont_index != 1 AND ml_spam_score = 0 | ml_spam_score=0 |
| Canonical | PASS | meta_canonical IS NULL OR = '' OR = src_unparsed | Not set |
| Property | Value |
|---|---|
| URL | https://www.visualcapitalist.com/us-president-approval-ratings-third-year-biden/ |
| Last Crawled | 2026-04-10 19:14:27 (1 day ago) |
| First Indexed | 2024-02-03 05:08:50 (2 years ago) |
| HTTP Status Code | 200 |
| Meta Title | Biden's Approval Rating Compared to Other Presidents |
| Meta Description | How does Biden's approval rating stack up against other presidents? This graphic compares presidents across modern history. |
| Meta Canonical | null |
| Boilerpipe Text | Ranked: The World’s Largest Air Forces in 2026
See visuals like this from many other data creators on our
Voronoi app
. Download it for free on
iOS
or
Android
and discover incredible data-driven charts from a variety of trusted sources.
Key Takeaways
The U.S. operates over 13,000 aircraft, more than the next three countries combined.
China ranks third in total aircraft but has one of the largest fighter fleets globally.
Six of the top eight air forces are in Asia, highlighting the region’s growing military focus.
Air power remains one of the clearest signals of military reach, and a key measure of how militaries project power globally.
This chart ranks the world’s largest air forces in 2026 by total aircraft, revealing a massive gap between the United States and every other country. It also breaks out fighter and interceptor fleets, offering a closer look at frontline combat strength.
The data for this visualization comes from
GlobalFirepower
, as of March 2026.
The U.S. Stands in a Class of Its Own
The most striking takeaway is the scale gap at the top.
The United States leads with 13,032 aircraft, more than the next three countries combined, putting it in a class of its own.
Russia ranks second with 4,237 aircraft, while China is third with 3,529.
Rank
Country
Total Aircraft
Fighters / Interceptors
1
🇺🇸 United States
13,032
1,791
2
🇷🇺 Russia
4,237
861
3
🇨🇳 China
3,529
1,443
4
🇮🇳 India
2,183
476
5
🇰🇷 South Korea
1,540
242
6
🇯🇵 Japan
1,429
217
7
🇵🇰 Pakistan
1,397
331
8
🇹🇷 Türkiye
1,101
201
9
🇪🇬 Egypt
1,088
242
10
🇫🇷 France
974
223
11
🇸🇦 Saudi Arabia
917
283
12
🇰🇵 North Korea
837
341
13
🇹🇼 Taiwan
720
258
14
🇮🇹 Italy
714
88
15
🇬🇧 United Kingdom
625
103
16
🇩🇿 Algeria
620
111
17
🇮🇱 Israel
597
239
18
🇦🇪 United Arab Emirates
581
99
19
🇩🇪 Germany
569
127
20
🇬🇷 Greece
560
178
The United States has long prioritized air dominance, and the size of its fleet reflects that strategy.
In fact, its 1,791 fighters and interceptors alone exceed the total aircraft inventories of many countries on this list.
Fighters vs. All Other Aircraft
Most aircraft in an air force aren’t combat jets. Instead, they are support systems that enable operations.
These include transport planes for moving troops and equipment, helicopters for mobility and logistics, training aircraft for pilot development, and specialized planes for refueling, surveillance, and electronic warfare. Together, these fleets determine how far, how fast, and how effectively a military can project air power.
Asia Commands Much of the Top 10
Air power is increasingly centered in Asia and the Middle East.
China, India, South Korea, Japan, Pakistan, and Türkiye all place in the top eight, while Egypt and Saudi Arabia also rank in the top 11.
Top Countries by Fighter Strength
Looking only at fighters and interceptors reveals a different balance of power.
China’s 1,443 fighter aircraft bring it closer to the U.S. in frontline combat aviation than total fleet size alone would suggest.
In addition, North Korea stands out, ranking 12th in total aircraft but fielding 341 fighters and interceptors, more than several countries with larger overall fleets. Meanwhile, nations like France, Israel, Taiwan, and Saudi Arabia show how relatively smaller air forces can still maintain substantial combat capability through a high share of fighter aircraft.
In modern warfare, total fleet size shows scale—but fighter strength and support capabilities together determine how that power is actually used.
Learn More on the Voronoi App
If you enjoyed today’s post, check out
Iran War Sees Lowest U.S. Approval Rating Ever
on
Voronoi
, the new app from Visual Capitalist. |
| Markdown | [](https://www.visualcapitalist.com/)
- [Subscribe to our Daily Newsletter](https://www.visualcapitalist.com/subscribe_pages/main/)
- [Browse Topics]()
- [Markets](https://www.visualcapitalist.com/category/markets/)
- [Technology](https://www.visualcapitalist.com/category/technology/)
- [Money](https://www.visualcapitalist.com/category/money-2/)
- [Energy](https://www.visualcapitalist.com/category/energy/)
- [Healthcare](https://www.visualcapitalist.com/category/healthcare/)
- [Maps](https://www.visualcapitalist.com/category/misc/maps/)
- [Mining](https://www.visualcapitalist.com/category/mining/)
- [Green](https://www.visualcapitalist.com/category/green/)
- [Politics](https://www.visualcapitalist.com/category/politics/)
- [Partner With Us](https://www.visualcapitalist.com/partnerwithus/)
- [VC+](https://store.visualcapitalist.com/)
- [Licensing](https://licensing.visualcapitalist.com/)
- [ Creator Program](https://www.visualcapitalist.com/us-president-approval-ratings-third-year-biden/)
- [Creator Stream](https://www.visualcapitalist.com/cp/)
- [Creator Community](https://www.visualcapitalist.com/creators/)
- [Creator Hub](https://www.visualcapitalist.com/creator-hub/)
- [Submission Guidelines & FAQs](https://www.visualcapitalist.com/creator-hub/faqs/)
- [Ad-Free](https://www.visualcapitalist.com/us-president-approval-ratings-third-year-biden/)
- [My Account](https://www.visualcapitalist.com/my-account/)
- [Log Out](https://www.visualcapitalist.com/wp-login.php?action=logout&_wpnonce=a9d8fcb2e5)
- [Purchase Ad-Free](https://store.visualcapitalist.com/ad-free/)
- [Reports](https://www.visualcapitalist.com/us-president-approval-ratings-third-year-biden/)
- [Global Forecast Report 2024 (VC+ Exclusive)](https://store.visualcapitalist.com/vc-archive/vc-reports/)
- [Election 2024: Charting the Key Issues (Exclusive VC+ eBook)](https://store.visualcapitalist.com/vc-archive/vc-reports/)
- [NPUC Annual Utility Decarbonization Report](https://decarbonization.visualcapitalist.com/decarbonization-annual-report/?utm_source=vc-web&utm_medium=fly-out&utm_campaign=annual-report)
- [Generational Power Index](https://www.visualcapitalist.com/gpi/)
- [Contact Us](https://www.visualcapitalist.com/contact-us/)
- [About](https://www.visualcapitalist.com/about/)
- []()
- [](https://voronoiapp.com/)
- [](https://www.visualcapitalist.com/terzo-markets-in-a-minute/)
- [](https://www.visualcapitalist.com/plasma-money-2/)
- [](https://decarbonization.visualcapitalist.com/)
- [](https://elements.visualcapitalist.com/)
- [](https://wealth.visualcapitalist.com/)
- [](https://money.visualcapitalist.com/)
Connect with us
[](https://www.visualcapitalist.com/) [](https://www.visualcapitalist.com/)
## Visual Capitalist
#### U.S. President Approval Ratings in Their Third Year (1955-2023)
- [VC+](https://www.visualcapitalist.com/vc-archive/)
- [Get VC+](https://www.visualcapitalist.com/get-more-vc/)
- [VC+ Archive](https://www.visualcapitalist.com/vc-archive/)
- [My Account](https://www.visualcapitalist.com/my-account/edit-account/)
- [Log In](https://www.visualcapitalist.com/wp-login.php)
- [Partner with Us](https://www.visualcapitalist.com/partnerwithus/)
[SUBSCRIBE](https://www.visualcapitalist.com/subscribe_pages/main/)
[](https://www.visualcapitalist.com/) [](https://www.visualcapitalist.com/)
## Visual Capitalist
#### U.S. President Approval Ratings in Their Third Year (1955-2023)
- [AI](https://www.visualcapitalist.com/category/technology/ai/)
- [Mapped: U.S. States Moving to Restrict Data Centers](https://www.visualcapitalist.com/mapped-data-center-restrictions-us-states/)
- [Ranked: The U.S. States Building the Most Data Centers](https://www.visualcapitalist.com/ranked-us-states-data-center-hotspots/)
- [Mapped: America’s Data Center Construction Boom](https://www.visualcapitalist.com/mapped-americas-data-center-construction-boom/)
- [Ranked: The Countries With the Most Data Centers](https://www.visualcapitalist.com/ranked-the-countries-with-the-most-data-centers/)
- [Ranked: Countries With the Most Patents](https://www.visualcapitalist.com/ranked-countries-with-the-most-patents/)
- [Markets](https://www.visualcapitalist.com/category/markets/)
- [SpaceX’s IPO Would Make It a Top 10 Company Globally](https://www.visualcapitalist.com/spacex-ipo-top-10-company-market-cap/)
- [Charted: The Global Stock Selloff as Oil Fears Rise](https://www.visualcapitalist.com/rocky-month-for-global-stock-indexes/)
- [Warren Buffett vs. the S\&P 500: Growth of \$100 (1965–2025)](https://www.visualcapitalist.com/warren-buffett-vs-the-sp-500-growth-of-100-1965-2025/)
- [Mapped: The World’s Riskiest Markets in 2026](https://www.visualcapitalist.com/mapped-the-worlds-riskiest-markets-in-2026/)
- [Ranked: The World’s Most Valuable Brands in 2026](https://www.visualcapitalist.com/ranked-the-worlds-most-valuable-brands-in-2026/)
- [Economy](https://www.visualcapitalist.com/category/economy/)
- [Mapped: How the Euro Spread Across Europe Since 1999](https://www.visualcapitalist.com/mapped-the-eurozone-in-2026/)
- [Mapped: Tax Burden by State in America](https://www.visualcapitalist.com/mapped-tax-burden-by-state-in-america/)
- [Mapped: Where Wealth Is Moving in America](https://www.visualcapitalist.com/u-s-states-gaining-and-losing-the-most-wealth/)
- [Mapped: Europe’s Biggest Budget Deficits](https://www.visualcapitalist.com/mapped-europes-biggest-budget-deficits/)
- [Ranked: America’s 20 Tallest Buildings](https://www.visualcapitalist.com/ranked-the-tallest-buildings-in-the-us/)
- [Technology](https://www.visualcapitalist.com/category/technology/)
- [SpaceX’s IPO Would Make It a Top 10 Company Globally](https://www.visualcapitalist.com/spacex-ipo-top-10-company-market-cap/)
- [Mapped: U.S. States Moving to Restrict Data Centers](https://www.visualcapitalist.com/mapped-data-center-restrictions-us-states/)
- [Ranked: Which Tech Companies Cut the Most Jobs?](https://www.visualcapitalist.com/ranked-biggest-tech-layoffs-by-company-2025-2026-ytd/)
- [Ranked: The U.S. States Building the Most Data Centers](https://www.visualcapitalist.com/ranked-us-states-data-center-hotspots/)
- [Mapped: America’s Data Center Construction Boom](https://www.visualcapitalist.com/mapped-americas-data-center-construction-boom/)
- [Money](https://www.visualcapitalist.com/category/money-2/)
- [Mapped: How the Euro Spread Across Europe Since 1999](https://www.visualcapitalist.com/mapped-the-eurozone-in-2026/)
- [Ranked: Wages by Country and Growth Since 2010](https://www.visualcapitalist.com/which-countries-saw-the-fastest-real-wage-growth-since-2010/)
- [Mapped: Europe’s Biggest Budget Deficits](https://www.visualcapitalist.com/mapped-europes-biggest-budget-deficits/)
- [Mapped: Where Americans 65+ Are Still Working](https://www.visualcapitalist.com/mapped-where-americans-65-are-still-working/)
- [Ranked: The World’s Richest Music Artists](https://www.visualcapitalist.com/ranked-the-worlds-richest-music-artists/)
- [Healthcare](https://www.visualcapitalist.com/category/healthcare/)
- [Mapped: Life Expectancy by U.S. State](https://www.visualcapitalist.com/mapped-us-life-expectancy-by-state/)
- [Mapped: U.S. States With the Highest Diabetes Rates](https://www.visualcapitalist.com/mapped-highest-diabetes-rates-by-state/)
- [Mapped: Adult Obesity Rates Across All 50 U.S. States](https://www.visualcapitalist.com/mapped-obesity-rates-highest-in-usa/)
- [Ranked: The World’s 10 Deadliest Viruses by Fatality Rate](https://www.visualcapitalist.com/ranked-the-worlds-10-deadliest-viruses-by-fatality-rate/)
- [Mapped: Health Insurance Costs by U.S. State in 2026](https://www.visualcapitalist.com/map-health-insurance-costs-in-every-u-s-state-in-2026/)
- [Demographics](https://www.visualcapitalist.com/category/demographics/)
- [Ranked: The World’s Fastest-Growing and Shrinking Populations (2000-2025)](https://www.visualcapitalist.com/ranked-countries-fastest-population-growth-decline-2000-2025/)
- [Mapped: Population Growth in Every Country (2000–2025)](https://www.visualcapitalist.com/mapped-population-growth-by-country-2000-2025/)
- [Mapped: Minimum Wages Across Europe](https://www.visualcapitalist.com/mapped-minimum-wages-across-europe/)
- [Mapped: How 50 Global Cities Rank for Raising a Family](https://www.visualcapitalist.com/raising-a-family-50-cities-global-map/)
- [Mapped: Life Expectancy by U.S. State](https://www.visualcapitalist.com/mapped-us-life-expectancy-by-state/)
- [Energy](https://www.visualcapitalist.com/category/energy/)
- [Ranked: The Countries Building the Most Nuclear Power](https://www.visualcapitalist.com/expected-nuclear-capacity-by-country/)
- [Half the World’s Oil Comes From Just Five Countries](https://www.visualcapitalist.com/half-the-worlds-oil-just-five-countries/)
- [Charted: America’s Oil Reversal, From Import Giant to Net Exporter](https://www.visualcapitalist.com/america-oil-reversal-net-exporter-chart/)
- [Ranked: Which Countries Shut Down the Most Nuclear Power?](https://www.visualcapitalist.com/ranked-which-countries-shut-down-the-most-nuclear-power/)
- [Mapped: The World’s Biggest Energy Sources by Country](https://www.visualcapitalist.com/worlds-biggest-energy-sources-by-country-map/)
- [Maps](https://www.visualcapitalist.com/category/misc/maps/)
- [Mapped: How the Euro Spread Across Europe Since 1999](https://www.visualcapitalist.com/mapped-the-eurozone-in-2026/)
- [Mapped: Tax Burden by State in America](https://www.visualcapitalist.com/mapped-tax-burden-by-state-in-america/)
- [Mapped: Where Wealth Is Moving in America](https://www.visualcapitalist.com/u-s-states-gaining-and-losing-the-most-wealth/)
- [Mapped: U.S. States Moving to Restrict Data Centers](https://www.visualcapitalist.com/mapped-data-center-restrictions-us-states/)
- [Mapped: Population Growth in Every Country (2000–2025)](https://www.visualcapitalist.com/mapped-population-growth-by-country-2000-2025/)
- [Mining](https://www.visualcapitalist.com/category/mining/)
- [Ranked: U.S. Import Reliance for 37 Critical Minerals](https://www.visualcapitalist.com/ranked-u-s-import-reliance-on-critical-minerals/)
- [Visualizing the Critical Minerals Powering the AI Boom](https://www.visualcapitalist.com/the-critical-minerals-powering-the-ai-boom/)
- [Ranked: The Critical Minerals Lost to U.S. Mining Waste, by Tonnage](https://www.visualcapitalist.com/ranked-the-critical-minerals-lost-to-u-s-mining-waste-by-tonnage/)
- [Ranked: The Countries Buying (and Selling) the Most Gold Since 2020](https://www.visualcapitalist.com/ranked-the-countries-buying-and-selling-the-most-gold-since-2020/)
- [Ranked: The World’s Top Copper Producers (2000 vs. 2024)](https://www.visualcapitalist.com/ranked-worlds-top-copper-producers-2000-2024/)
- [Green](https://www.visualcapitalist.com/category/green/)
- [Ranked: The Countries Building the Most Nuclear Power](https://www.visualcapitalist.com/expected-nuclear-capacity-by-country/)
- [Ranked: CO2 Emissions Per Person by Major Economy](https://www.visualcapitalist.com/ranked-co2-per-capita-by-major-economy/)
- [Mapped: The World’s Most Water-Stressed Countries](https://www.visualcapitalist.com/mapped-the-worlds-most-water-stressed-countries/)
- [Ranked: Which Countries Shut Down the Most Nuclear Power?](https://www.visualcapitalist.com/ranked-which-countries-shut-down-the-most-nuclear-power/)
- [Ranked: The Deadliest Types of Extreme Weather Worldwide](https://www.visualcapitalist.com/extreme-weather-types-fatalities/)
### [Politics](https://www.visualcapitalist.com/category/politics/)
# U.S. President Approval Ratings in Their Third Year (1955-2023)

Published
2 years ago
on
February 2, 2024
By
[Marcus Lu](https://www.visualcapitalist.com/author/marcus/ "Posts by Marcus Lu")
[](https://www.voronoiapp.com/) See this visualization first on the [Voronoi](https://www.voronoiapp.com/) app.
[](https://posts.voronoiapp.com/politics/Bidens-Approval-Rating-is-the-Second-Lowest-in-Modern-History-590)
- [Twitter](https://www.visualcapitalist.com/us-president-approval-ratings-third-year-biden/)
- [Facebook](https://www.visualcapitalist.com/us-president-approval-ratings-third-year-biden/)
- [LinkedIn](https://www.visualcapitalist.com/us-president-approval-ratings-third-year-biden/)
- [Reddit](https://www.visualcapitalist.com/us-president-approval-ratings-third-year-biden/)
- [Pinterest](https://www.visualcapitalist.com/us-president-approval-ratings-third-year-biden/)
- [Email](https://www.visualcapitalist.com/us-president-approval-ratings-third-year-biden/)
## Biden’s Approval Rating Compared to Other Presidents
*This was originally posted on our [Voronoi app](https://posts.voronoiapp.com/natural-resources/Canada-Accounts-for-17-of-Global-Uranium-Output-Since-1945--506). Download the app for free on [iOS](https://apps.apple.com/ca/app/voronoi-app/id6447905904) or [Android](https://play.google.com/store/apps/details?id=com.voronoi.organization.app&pli=1) and discover incredible data-driven charts from a variety of trusted sources.*
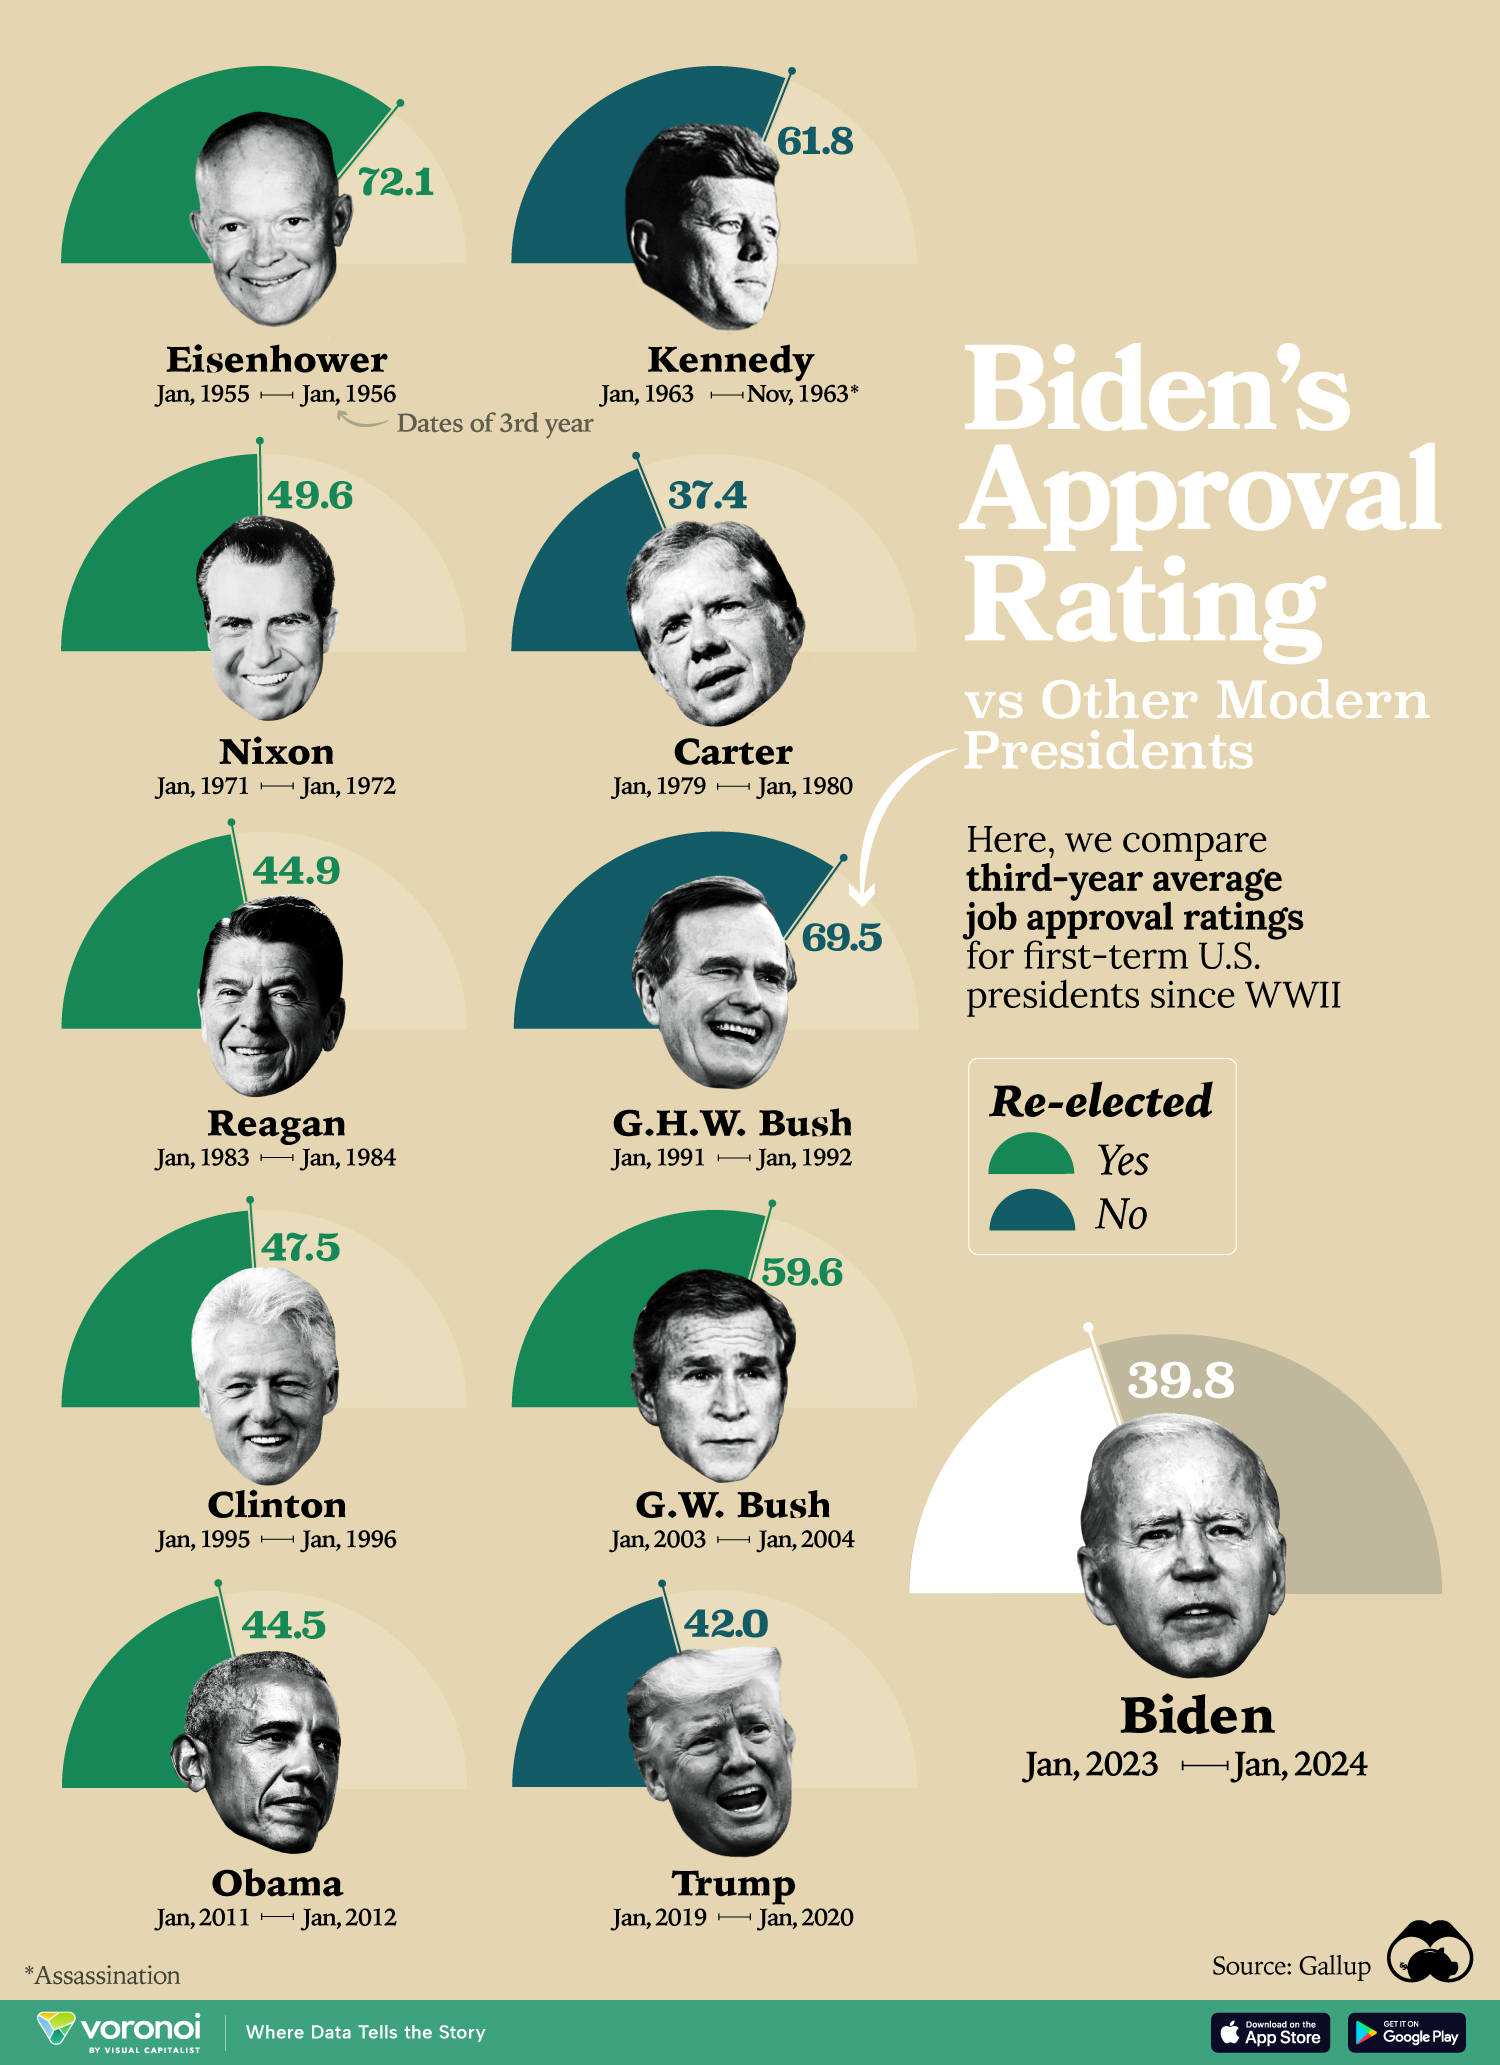
President Biden’s approval rating is the second lowest in modern history for a first-term president.
Today, **under 40%** of Americans approve of his job performance, a level it has hovered around over the last year. According to recent polls, younger Democrats have a lower approval rating of Biden’s handling of the economy compared to older Democrats. Leading up to the election in 2024, the state of the economy is the most important issue among Americans.
This graphic shows approval ratings for first-term U.S. presidents in their third year—and whether or not they were re-elected—based on data from [Gallup](https://news.gallup.com/poll/609188/biden-third-year-job-approval-average-second-worst.aspx).
## First-Term Presidential Approval Ratings, Ranked
Here’s how Biden’s approval rating in year three stacks up against past U.S. presidents:
| President | Third Year | Average Approval Rating | Re-elected? |
|---|---|---|---|
| Eisenhower | 1955-1956 | 72\.1 | Yes |
| G.H.W. Bush | 1991-1992 | 69\.5 | No |
| Kennedy | 1963\* | 61\.8 | No |
| G.W. Bush | 2003-2004 | 59\.6 | Yes |
| Nixon | 1971-1972 | 49\.6 | Yes |
| Clinton | 1995-1996 | 47\.5 | Yes |
| Reagan | 1983-1984 | 44\.9 | Yes |
| Obama | 2011-2012 | 44\.5 | Yes |
| Trump | 2019-2020 | 42\.0 | No |
| Biden | 2023-2024 | 39\.8 | – |
| Carter | 1978-1980 | 37\.4 | No |
Average annual approval ratings from January 20 through to January 19 in the following year. \*Approval ratings for Kennedy are from January 20-November 22 1963 due to assassination.
We can see that Biden falls near the bottom, with President Carter being the only president to have lower ratings in their third year.
Biden’s political standing has fallen from a peak of **63%** in 2021 given concerns of rising costs and the state of his fitness. The Israel-Hamas war is also weighing on his ratings, with younger Democrats criticizing his handling of the crisis.
While Biden struggles to achieve majority approval, economic indicators have been optimistic. The unemployment rate remains low, GDP growth is strong, and the S\&P 500 recently hit record highs. Despite this, Americans are paying attention to the cost of basic goods, which have grown more expensive in the last few years.
The U.S is among the most [polarized countries](https://www.visualcapitalist.com/polarization-across-28-countries/) globally, stemming from low trust in the media, economic anxieties, and low trust in the government. As a Biden-Trump rematch looks increasingly likely, political success hinges on who will align most with voter concerns, and whether disaffected Democrats will elect Biden for a second term.

Related Topics:[us presidents](https://www.visualcapitalist.com/tag/us-presidents/)[presidential elections](https://www.visualcapitalist.com/tag/presidential-elections/)[Biden Administration](https://www.visualcapitalist.com/tag/biden-administration/)[US politics](https://www.visualcapitalist.com/tag/us-politics/)[approval ratings](https://www.visualcapitalist.com/tag/approval-ratings/)
[Up Next How Do Democrats and Republicans Feel About Certain U.S. Industries?](https://www.visualcapitalist.com/us-industry-favorability-democrats-republicans/)
[Don't Miss Charted: The Approval Ratings of World Leaders in 2024](https://www.visualcapitalist.com/approval-ratings-of-world-leaders-in-2024/)
#### You may also like
### [Military](https://www.visualcapitalist.com/category/misc/military/)
# Ranked: The World’s Largest Air Forces in 2026
See which countries have the biggest military aircraft fleets, led by the U.S., Russia, and China.


Published
3 days ago
on
April 7, 2026
By
[Bruno Venditti](https://www.visualcapitalist.com/author/bruno/ "Posts by Bruno Venditti")

## Ranked: The World’s Largest Air Forces in 2026
*See visuals like this from many other data creators on our [Voronoi app](https://www.voronoiapp.com/). Download it for free on [iOS](https://apps.apple.com/ca/app/voronoi-app/id6447905904) or [Android](https://play.google.com/store/apps/details?id=com.voronoi.organization.app&pli=1) and discover incredible data-driven charts from a variety of trusted sources.*
### Key Takeaways
- The U.S. operates over 13,000 aircraft, more than the next three countries combined.
- China ranks third in total aircraft but has one of the largest fighter fleets globally.
- Six of the top eight air forces are in Asia, highlighting the region’s growing military focus.
Air power remains one of the clearest signals of military reach, and a key measure of how militaries project power globally.
This chart ranks the world’s largest air forces in 2026 by total aircraft, revealing a massive gap between the United States and every other country. It also breaks out fighter and interceptor fleets, offering a closer look at frontline combat strength.
The data for this visualization comes from [GlobalFirepower](https://www.globalfirepower.com/aircraft-total.php), as of March 2026.
## The U.S. Stands in a Class of Its Own
The most striking takeaway is the scale gap at the top.
The United States leads with 13,032 aircraft, more than the next three countries combined, putting it in a class of its own.
Russia ranks second with 4,237 aircraft, while China is third with 3,529.
| Rank | Country | Total Aircraft | Fighters / Interceptors |
|---|---|---|---|
| 1 | 🇺🇸 United States | 13,032 | 1,791 |
| 2 | 🇷🇺 Russia | 4,237 | 861 |
| 3 | 🇨🇳 China | 3,529 | 1,443 |
| 4 | 🇮🇳 India | 2,183 | 476 |
| 5 | 🇰🇷 South Korea | 1,540 | 242 |
| 6 | 🇯🇵 Japan | 1,429 | 217 |
| 7 | 🇵🇰 Pakistan | 1,397 | 331 |
| 8 | 🇹🇷 Türkiye | 1,101 | 201 |
| 9 | 🇪🇬 Egypt | 1,088 | 242 |
| 10 | 🇫🇷 France | 974 | 223 |
| 11 | 🇸🇦 Saudi Arabia | 917 | 283 |
| 12 | 🇰🇵 North Korea | 837 | 341 |
| 13 | 🇹🇼 Taiwan | 720 | 258 |
| 14 | 🇮🇹 Italy | 714 | 88 |
| 15 | 🇬🇧 United Kingdom | 625 | 103 |
| 16 | 🇩🇿 Algeria | 620 | 111 |
| 17 | 🇮🇱 Israel | 597 | 239 |
| 18 | 🇦🇪 United Arab Emirates | 581 | 99 |
| 19 | 🇩🇪 Germany | 569 | 127 |
| 20 | 🇬🇷 Greece | 560 | 178 |
The United States has long prioritized air dominance, and the size of its fleet reflects that strategy.
In fact, its 1,791 fighters and interceptors alone exceed the total aircraft inventories of many countries on this list.
## Fighters vs. All Other Aircraft
Most aircraft in an air force aren’t combat jets. Instead, they are support systems that enable operations.
These include transport planes for moving troops and equipment, helicopters for mobility and logistics, training aircraft for pilot development, and specialized planes for refueling, surveillance, and electronic warfare. Together, these fleets determine how far, how fast, and how effectively a military can project air power.
## Asia Commands Much of the Top 10
Air power is increasingly centered in Asia and the Middle East.
China, India, South Korea, Japan, Pakistan, and Türkiye all place in the top eight, while Egypt and Saudi Arabia also rank in the top 11.
## Top Countries by Fighter Strength
Looking only at fighters and interceptors reveals a different balance of power.
China’s 1,443 fighter aircraft bring it closer to the U.S. in frontline combat aviation than total fleet size alone would suggest.
In addition, North Korea stands out, ranking 12th in total aircraft but fielding 341 fighters and interceptors, more than several countries with larger overall fleets. Meanwhile, nations like France, Israel, Taiwan, and Saudi Arabia show how relatively smaller air forces can still maintain substantial combat capability through a high share of fighter aircraft.
In modern warfare, total fleet size shows scale—but fighter strength and support capabilities together determine how that power is actually used.
## Learn More on the Voronoi App 
If you enjoyed today’s post, check out [Iran War Sees Lowest U.S. Approval Rating Ever](https://www.voronoiapp.com/geopolitics/Iran-War-Sees-Lowest-US-Approval-Rating-Ever--7974) on **Voronoi**, the new app from Visual Capitalist.

[Continue Reading](https://www.visualcapitalist.com/ranked-the-worlds-largest-air-forces-in-2026/)
### [Military](https://www.visualcapitalist.com/category/misc/military/)
# Ranked: The Biggest Arms Importers in 2025
Arms importing countries ranked by global share in 2025, led by Saudi Arabia.


Published
3 days ago
on
April 7, 2026
By
[Niccolo Conte](https://www.visualcapitalist.com/author/niccolo/ "Posts by Niccolo Conte")

## Ranked: The Biggest Arms Importers in 2025
*See visuals like this from many other data creators on our [Voronoi app](https://www.voronoiapp.com/). Download it for free on [iOS](https://apps.apple.com/ca/app/voronoi-app/id6447905904) or [Android](https://play.google.com/store/apps/details?id=com.voronoi.organization.app&pli=1) and discover incredible data-driven charts from a variety of trusted sources.*
### Key Takeaways
- Saudi Arabia is the world’s largest arms importer, accounting for 9.1% of global demand.
- Europe now makes up nearly 40% of global arms imports amid rising security concerns.
- India, Ukraine, and Poland rank among the top buyers, reflecting ongoing regional tensions.
Global demand for military equipment is rising as countries respond to conflict, uncertainty, and shifting alliances.
This chart ranks the world’s largest arms importers in 2025, based on data from the [SIPRI Arms Transfers Database](https://armstransfers.sipri.org/ArmsTransfer/) (March 2026). It shows which nations are driving the surge in defense spending and where demand is accelerating fastest.
## Middle East and Asia Lead Demand
Saudi Arabia leads global arms imports by a wide margin, accounting for 9.1% of total demand, more than any other country. Its sustained spending highlights a broader trend. Nations are accelerating military upgrades in response to prolonged regional instability.
| Rank | Country | % of Global Arms Imports |
|---|---|---|
| 1 | 🇸🇦 Saudi Arabia | 9\.1% |
| 2 | 🇮🇳 India | 8\.6% |
| 3 | 🇺🇦 Ukraine | 6\.8% |
| 4 | 🇵🇱 Poland | 6\.5% |
| 5 | 🇯🇵 Japan | 5\.1% |
| 6 | 🇩🇪 Germany | 4\.9% |
| 7 | 🇮🇩 Indonesia | 3\.8% |
| 8 | 🇶🇦 Qatar | 3\.1% |
| 9 | 🇦🇪 United Arab Emirates | 2\.6% |
| 10 | 🇵🇭 Philippines | 2\.5% |
| 11 | 🇦🇺 Australia | 2\.5% |
| 12 | 🇳🇱 Netherlands | 2\.5% |
| 13 | 🇺🇸 United States | 2\.2% |
| 14 | 🇵🇰 Pakistan | 2\.1% |
| 15 | 🇪🇬 Egypt | 2\.1% |
| 16 | 🇬🇧 United Kingdom | 1\.8% |
| 17 | 🇬🇷 Greece | 1\.7% |
| 18 | 🇮🇹 Italy | 1\.7% |
| 19 | 🇧🇬 Bulgaria | 1\.6% |
| 20 | 🇮🇱 Israel | 1\.6% |
| 21 | 🇧🇾 Belarus | 1\.4% |
| 22 | 🇦🇿 Azerbaijan | 1\.4% |
| 23 | 🇧🇷 Brazil | 1\.4% |
| 24 | 🇸🇰 Slovakia | 1\.3% |
| 25 | 🇧🇪 Belgium | 1\.3% |
| 26 | 🇷🇴 Romania | 1\.3% |
| 27 | 🇳🇴 Norway | 1\.2% |
| 28 | 🇭🇺 Hungary | 1\.2% |
| 29 | 🇹🇼 Taiwan | 1\.2% |
| 30 | 🇲🇦 Morocco | 1\.2% |
| 31 | 🇹🇷 Turkiye | 1\.1% |
| 32 | 🇰🇼 Kuwait | 0\.9% |
| 33 | 🇩🇰 Denmark | 0\.8% |
| 34 | 🇪🇸 Spain | 0\.7% |
| 35 | 🇫🇷 France | 0\.7% |
| 36 | 🇰🇷 South Korea | 0\.7% |
| 37 | 🇨🇳 China | 0\.6% |
| 38 | 🇪🇪 Estonia | 0\.6% |
| 39 | 🇻🇳 Viet Nam | 0\.5% |
| 40 | 🇸🇪 Sweden | 0\.4% |
| 41 | 🇷🇸 Serbia | 0\.4% |
| 42 | 🇭🇷 Croatia | 0\.4% |
| 43 | 🇷🇺 Russia | 0\.4% |
| 44 | 🇰🇪 Kenya | 0\.3% |
| 45 | 🇩🇿 Algeria | 0\.3% |
| 46 | 🇦🇷 Argentina | 0\.3% |
| 47 | 🇵🇪 Peru | 0\.3% |
| 48 | 🇵🇹 Portugal | 0\.3% |
| 49 | 🇦🇴 Angola | 0\.3% |
| \-- | 🌍 Other | 4\.3% |
India follows closely at 8.6%, maintaining its position as a top importer due to ongoing regional tensions and the need to upgrade military capabilities. Meanwhile, countries like Qatar and the United Arab Emirates remain major buyers, reinforcing the Middle East’s [strong presence](https://www.visualcapitalist.com/mapped-every-us-military-base-in-the-middle-east/) in global arms demand.
### Europe’s Rapid Expansion
Europe now accounts for 39.9% of global arms imports, the largest regional share by far. This sharp increase reflects a rapid buildup in defense capabilities following the war in Ukraine and a broader shift toward rearmament across the continent.
Ukraine ranks third globally with a 6.8% share, reflecting urgent military needs due to the [war with Russia](https://www.visualcapitalist.com/charted-ukraine-is-russias-third-deadliest-war/).
### Broad Global Participation
While the top importers dominate headlines, arms demand is spread across dozens of countries, underscoring how widespread military investment has become in today’s geopolitical climate.
Nations like Japan, Germany, and Indonesia each hold significant shares. Smaller importers also represent a meaningful portion of the market, with the “Other” category accounting for 4.3% of global imports.
## Learn More on the Voronoi App 
If you enjoyed today’s post, check out [Where Are the World’s Nuclear Warheads?](https://www.voronoiapp.com/military/Where-are-the-worlds-nuclear-warheads-7957) on **Voronoi**, the new app from Visual Capitalist.

[Continue Reading](https://www.visualcapitalist.com/ranked-the-biggest-arms-importers-in-2025/)
#### Popular
[](https://www.visualcapitalist.com/)
- [𝕏](https://www.twitter.com/visualcap)
- [About](https://www.visualcapitalist.com/about/)
- [Subscribe](https://www.visualcapitalist.com/subscribe_pages/main/)
- [VC+](https://www.visualcapitalist.com/get-more-vc/)
- [Voronoi](https://www.voronoiapp.com/)
- [Masthead](https://www.visualcapitalist.com/masthead/)
- [Press Center](https://www.visualcapitalist.com/press-center/)
- [Careers](https://www.visualcapitalist.com/careers/)
- [Contact Us](https://www.visualcapitalist.com/contact-us/)
- [FAQ](https://www.visualcapitalist.com/frequently-asked-questions/)
- [Use Our Visualizations](https://www.visualcapitalist.com/use-our-visualizations/)
- [Licensing](https://licensing.visualcapitalist.com/)
- [Partner With Us](https://www.visualcapitalist.com/partnerwithus/)
- [Content Calendar](https://www.visualcapitalist.com/partnerwithus/contentcalendar/)
Copyright © 2026 Visual Capitalist \| [Privacy Policy](https://www.visualcapitalist.com/privacy-policy/)

 |
| Readable Markdown | ## Ranked: The World’s Largest Air Forces in 2026
*See visuals like this from many other data creators on our [Voronoi app](https://www.voronoiapp.com/). Download it for free on [iOS](https://apps.apple.com/ca/app/voronoi-app/id6447905904) or [Android](https://play.google.com/store/apps/details?id=com.voronoi.organization.app&pli=1) and discover incredible data-driven charts from a variety of trusted sources.*
### Key Takeaways
- The U.S. operates over 13,000 aircraft, more than the next three countries combined.
- China ranks third in total aircraft but has one of the largest fighter fleets globally.
- Six of the top eight air forces are in Asia, highlighting the region’s growing military focus.
Air power remains one of the clearest signals of military reach, and a key measure of how militaries project power globally.
This chart ranks the world’s largest air forces in 2026 by total aircraft, revealing a massive gap between the United States and every other country. It also breaks out fighter and interceptor fleets, offering a closer look at frontline combat strength.
The data for this visualization comes from [GlobalFirepower](https://www.globalfirepower.com/aircraft-total.php), as of March 2026.
## The U.S. Stands in a Class of Its Own
The most striking takeaway is the scale gap at the top.
The United States leads with 13,032 aircraft, more than the next three countries combined, putting it in a class of its own.
Russia ranks second with 4,237 aircraft, while China is third with 3,529.
| Rank | Country | Total Aircraft | Fighters / Interceptors |
|---|---|---|---|
| 1 | 🇺🇸 United States | 13,032 | 1,791 |
| 2 | 🇷🇺 Russia | 4,237 | 861 |
| 3 | 🇨🇳 China | 3,529 | 1,443 |
| 4 | 🇮🇳 India | 2,183 | 476 |
| 5 | 🇰🇷 South Korea | 1,540 | 242 |
| 6 | 🇯🇵 Japan | 1,429 | 217 |
| 7 | 🇵🇰 Pakistan | 1,397 | 331 |
| 8 | 🇹🇷 Türkiye | 1,101 | 201 |
| 9 | 🇪🇬 Egypt | 1,088 | 242 |
| 10 | 🇫🇷 France | 974 | 223 |
| 11 | 🇸🇦 Saudi Arabia | 917 | 283 |
| 12 | 🇰🇵 North Korea | 837 | 341 |
| 13 | 🇹🇼 Taiwan | 720 | 258 |
| 14 | 🇮🇹 Italy | 714 | 88 |
| 15 | 🇬🇧 United Kingdom | 625 | 103 |
| 16 | 🇩🇿 Algeria | 620 | 111 |
| 17 | 🇮🇱 Israel | 597 | 239 |
| 18 | 🇦🇪 United Arab Emirates | 581 | 99 |
| 19 | 🇩🇪 Germany | 569 | 127 |
| 20 | 🇬🇷 Greece | 560 | 178 |
The United States has long prioritized air dominance, and the size of its fleet reflects that strategy.
In fact, its 1,791 fighters and interceptors alone exceed the total aircraft inventories of many countries on this list.
## Fighters vs. All Other Aircraft
Most aircraft in an air force aren’t combat jets. Instead, they are support systems that enable operations.
These include transport planes for moving troops and equipment, helicopters for mobility and logistics, training aircraft for pilot development, and specialized planes for refueling, surveillance, and electronic warfare. Together, these fleets determine how far, how fast, and how effectively a military can project air power.
## Asia Commands Much of the Top 10
Air power is increasingly centered in Asia and the Middle East.
China, India, South Korea, Japan, Pakistan, and Türkiye all place in the top eight, while Egypt and Saudi Arabia also rank in the top 11.
## Top Countries by Fighter Strength
Looking only at fighters and interceptors reveals a different balance of power.
China’s 1,443 fighter aircraft bring it closer to the U.S. in frontline combat aviation than total fleet size alone would suggest.
In addition, North Korea stands out, ranking 12th in total aircraft but fielding 341 fighters and interceptors, more than several countries with larger overall fleets. Meanwhile, nations like France, Israel, Taiwan, and Saudi Arabia show how relatively smaller air forces can still maintain substantial combat capability through a high share of fighter aircraft.
In modern warfare, total fleet size shows scale—but fighter strength and support capabilities together determine how that power is actually used.
## Learn More on the Voronoi App 
If you enjoyed today’s post, check out [Iran War Sees Lowest U.S. Approval Rating Ever](https://www.voronoiapp.com/geopolitics/Iran-War-Sees-Lowest-US-Approval-Rating-Ever--7974) on **Voronoi**, the new app from Visual Capitalist. |
| Shard | 133 (laksa) |
| Root Hash | 14085349958231439733 |
| Unparsed URL | com,visualcapitalist!www,/us-president-approval-ratings-third-year-biden/ s443 |