ℹ️ Skipped - page is already crawled
| Filter | Status | Condition | Details |
|---|---|---|---|
| HTTP status | PASS | download_http_code = 200 | HTTP 200 |
| Age cutoff | PASS | download_stamp > now() - 6 MONTH | 0.2 months ago |
| History drop | PASS | isNull(history_drop_reason) | No drop reason |
| Spam/ban | PASS | fh_dont_index != 1 AND ml_spam_score = 0 | ml_spam_score=0 |
| Canonical | PASS | meta_canonical IS NULL OR = '' OR = src_unparsed | Not set |
| Property | Value | |||||||||
|---|---|---|---|---|---|---|---|---|---|---|
| URL | https://www.statisticshowto.com/james-stein-estimator/ | |||||||||
| Last Crawled | 2026-04-18 09:11:30 (4 days ago) | |||||||||
| First Indexed | 2020-04-04 23:30:45 (6 years ago) | |||||||||
| HTTP Status Code | 200 | |||||||||
| Content | ||||||||||
| Meta Title | James-Stein Estimator: Definition, Formulas - Statistics How To | |||||||||
| Meta Description | Simple definition for the James-Stein estimator: statistics terms in plain English. Formulas for the James-Stein estimator. Shrinking constant explained. | |||||||||
| Meta Canonical | null | |||||||||
| Boilerpipe Text | Estimators
> James-Stein Estimator
What is the James-Stein Estimator?
It’s common in statistics to take averages to make predictions. For example, the
sample mean
(the
average
score from all samples) is used as an estimator for the
population mean
.
James-Stein estimators
improve upon these averages by
shrinking
them towards a more central average. The technique is named after Charles Stein and Willard James, who simplified Stein’s original 1956 method.
Calculations
The basic steps are:
Calculate the sample mean (X̄).
“Shrink” individual scores towards (X̄); Reduce larger values and increase smaller values.
Each of these individual shrunk values is a James-Stein estimator,
z.
The basic formula for the James-Stein estimator is:
z = x̄ + c(y – x̄)
Where:
(y – x̄) = difference between an individual score and the sample mean,
c = a shrinking factor.
Other formulas exist, but they all have the shrinking factor in common.
For example, instead of the sample mean you could use the mean from a
prior distribution
(
m
). In that case, ȳ could be replaced by
m
. The shrinking factor’s value is calculate after collecting the sample data and is given by the formula:
Where:
x = individual values,
x̄ = sample mean,
k = number of unknown means (must be 2 or more),
σ
2
=
variance
.
The shrinking factor’s value should be less than 1. For example, a value of .3 would shrink values by about 70 percent.
James-Stein Estimators vs. Sample Means
The James-Stein estimator is a significant departure from the “traditional” school of thought which states that the sample mean is the best estimator for the population mean. Stein and James proved that a better estimator than the “perfect” estimator exists, which seems to be somewhat of a paradox. However, the James-Stein estimator outperforms the sample mean when there are
several
unknown population means — not just one. The means do not have to be related, so they have to be carefully chosen.
Combining completely unrelated means will give you a result — but it will be a nonsensical one.
Bradley Efron and Carl Morris (1977) offer the extreme example of combining batting averages in baseball and proportions of imported cars; You can calculate a mean for these, but it will make no sense at all.
References
Efron, B. and Morris, C. (1977), “Stein’s Paradox in Statistics.” Scientific American. 236 (5): 119–127
James, W., and Stein, C., (1961). “Estimation with Quadratic Loss.” Proceedings of the Fourth Berkeley Symposium, Vol. 1 (Berkeley, California: University of California Press), pp. 361-379.
Stein C. (1956). “Inadmissibility of the usual estimator for the mean of a
multivariate normal distribution
”. Proceedings of the Third Berkeley Symposium on Mathematical Statistics and Probability. Vol. 1. University of California Press; Berkeley, CA, USA: pp. 197–208
Comments? Need to post a correction?
Please
Contact Us
. | |||||||||
| Markdown | [Skip to content](https://www.statisticshowto.com/james-stein-estimator/#content "Skip to content")
[Statistics How To](https://www.statisticshowto.com/)
Menu
- [Home](https://www.statisticshowto.com/)
- [Tables](https://www.statisticshowto.com/tables/)
- [Binomial Distribution Table](https://www.statisticshowto.com/tables/binomial-distribution-table/)
- [F Table](https://www.statisticshowto.com/tables/f-table/)
- [Inverse T Distribution Table](https://www.statisticshowto.com/tables/inverse-t-distribution-table/)
- [PPMC Critical Values](https://www.statisticshowto.com/tables/ppmc-critical-values/)
- [T-Distribution Table (One Tail and Two-Tails)](https://www.statisticshowto.com/tables/t-distribution-table/)
- [Chi Squared Table (Right Tail)](https://www.statisticshowto.com/tables/chi-squared-table-right-tail/)
- [Z-table (Right of Curve or Left)](https://www.statisticshowto.com/tables/z-table/)
- [Probability and Statistics](https://www.statisticshowto.com/probability-and-statistics/)
- [Binomials](https://www.statisticshowto.com/probability-and-statistics/binomial-theorem/)
- [Chi-Square Statistic](https://www.statisticshowto.com/probability-and-statistics/chi-square/)
- [Expected Value](https://www.statisticshowto.com/probability-and-statistics/expected-value/)
- [Hypothesis Testing](https://www.statisticshowto.com/probability-and-statistics/hypothesis-testing/)
- [Non Normal Distribution](https://www.statisticshowto.com/probability-and-statistics/non-normal-distributions/)
- [Normal Distributions](https://www.statisticshowto.com/probability-and-statistics/normal-distributions/)
- [Probability](https://www.statisticshowto.com/probability-and-statistics/probability-main-index/)
- [Regression Analysis](https://www.statisticshowto.com/probability-and-statistics/regression-analysis/)
- [Statistics Basics](https://www.statisticshowto.com/statistics-basics/)
- [T-Distribution](https://www.statisticshowto.com/probability-and-statistics/t-distribution/)
- [Multivariate Analysis & Independent Component](https://www.statisticshowto.com/probability-and-statistics/multivariate-analysis/)
- [Sampling](https://www.statisticshowto.com/probability-and-statistics/sampling-in-statistics/)
- [Calculators](https://www.statisticshowto.com/calculators/)
- [Variance and Standard Deviation Calculator](https://www.statisticshowto.com/calculators/variance-and-standard-deviation-calculator/)
- [Tdist Calculator](https://www.statisticshowto.com/calculators/tdist-calculator/)
- [Permutation Calculator / Combination Calculator](https://www.statisticshowto.com/calculators/permutation-calculator-and-combination-calculator/)
- [Interquartile Range Calculator](https://www.statisticshowto.com/calculators/interquartile-range-calculator/)
- [Linear Regression Calculator](https://www.statisticshowto.com/calculators/linear-regression-calculator/)
- [Expected Value Calculator](https://www.statisticshowto.com/calculators/expected-value-calculator/)
- [Binomial Distribution Calculator](https://www.statisticshowto.com/calculators/binomial-distribution-calculator/)
- [Matrices](https://www.statisticshowto.com/matrices-and-matrix-algebra/)
- [Experimental Design](https://www.statisticshowto.com/experimental-design/)
- [Calculus Based Statistics](https://www.statisticshowto.com/probability-and-statistics/calculus-based-statistics/)
# James-Stein Estimator: Definition, Formulas
[Estimators](https://www.statisticshowto.com/estimator/) \> James-Stein Estimator
## What is the James-Stein Estimator?
It’s common in statistics to take averages to make predictions. For example, the [sample mean](https://www.statisticshowto.com/probability-and-statistics/statistics-definitions/sample-mean/) (the [average](https://www.statisticshowto.com/arithmetic-mean/) score from all samples) is used as an estimator for the [population mean](https://www.statisticshowto.com/population-mean/). **James-Stein estimators** improve upon these averages by [shrinking](https://www.statisticshowto.com/shrinkage-estimator/) them towards a more central average. The technique is named after Charles Stein and Willard James, who simplified Stein’s original 1956 method.
## Calculations
The basic steps are:
1. Calculate the sample mean (X̄).
2. “Shrink” individual scores towards (X̄); Reduce larger values and increase smaller values. **Each of these individual shrunk values is a James-Stein estimator,** z.
The basic formula for the James-Stein estimator is:
**z = x̄ + c(y – x̄)**
Where:
- (y – x̄) = difference between an individual score and the sample mean,
- c = a shrinking factor.
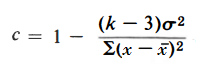
**Other formulas exist, but they all have the shrinking factor in common.** For example, instead of the sample mean you could use the mean from a [prior distribution](https://www.statisticshowto.com/prior-distribution/) (*m*). In that case, ȳ could be replaced by *m*. The shrinking factor’s value is calculate after collecting the sample data and is given by the formula:
[](https://www.statisticshowto.com/wp-content/uploads/2016/10/shrinking-factor-james-stein-estimator.png)
Where:
- x = individual values,
- x̄ = sample mean,
- k = number of unknown means (must be 2 or more),
- σ2 = [variance](https://www.statisticshowto.com/probability-and-statistics/variance/).
The shrinking factor’s value should be less than 1. For example, a value of .3 would shrink values by about 70 percent.
## James-Stein Estimators vs. Sample Means
The James-Stein estimator is a significant departure from the “traditional” school of thought which states that the sample mean is the best estimator for the population mean. Stein and James proved that a better estimator than the “perfect” estimator exists, which seems to be somewhat of a paradox. However, the James-Stein estimator outperforms the sample mean when there are *several* unknown population means — not just one. The means do not have to be related, so they have to be carefully chosen. **Combining completely unrelated means will give you a result — but it will be a nonsensical one.** Bradley Efron and Carl Morris (1977) offer the extreme example of combining batting averages in baseball and proportions of imported cars; You can calculate a mean for these, but it will make no sense at all.
## References
Efron, B. and Morris, C. (1977), “Stein’s Paradox in Statistics.” Scientific American. 236 (5): 119–127
James, W., and Stein, C., (1961). “Estimation with Quadratic Loss.” Proceedings of the Fourth Berkeley Symposium, Vol. 1 (Berkeley, California: University of California Press), pp. 361-379.
Stein C. (1956). “Inadmissibility of the usual estimator for the mean of a [multivariate normal distribution](https://www.statisticshowto.com/bivariate-normal-distribution/)”. Proceedings of the Third Berkeley Symposium on Mathematical Statistics and Probability. Vol. 1. University of California Press; Berkeley, CA, USA: pp. 197–208
[Deterministic: Definition and Examples](https://www.statisticshowto.com/deterministic/)
[Shrinkage Estimator: Definition, Examples](https://www.statisticshowto.com/shrinkage-estimator/)
**Comments? Need to post a correction?** Please [***Contact Us***](https://www.statisticshowto.com/contact/).
Check out our **["Practically Cheating Statistics Handbook](https://www.statisticshowto.com/?page_id=15743&preview=true")**, which gives you hundreds of easy-to-follow answers in a convenient e-book.
[](https://www.statisticshowto.com/?page_id=15743&preview=true)
***
**Readers are calling it suspenseful, haunting, and unforgettable. Check out Stephanie’s debut post-apocalyptic novel — available now on Amazon.**
[](https://amzn.to/3LLzICB)
Looking for elementary [**statistics help**](https://www.statisticshowto.com/help-with-statistics-equations/)? You’ve come to the right place. **Statistics How To** has more than 1,000 articles and **videos** for elementary statistics, probability, AP and advanced statistics topics. **Looking for a specific topic?** Type it into the search box at the top of the page.
Latest articles
- [Hedges’ g: Definition, Formula](https://www.statisticshowto.com/hedges-g/)
- [Kaiser-Meyer-Olkin (KMO) Test for Sampling Adequacy](https://www.statisticshowto.com/kaiser-meyer-olkin/)
- [Benjamini-Hochberg Procedure](https://www.statisticshowto.com/benjamini-hochberg-procedure/)
- [Tetrachoric Correlation: Definition, Examples, Formula](https://www.statisticshowto.com/tetrachoric-correlation/)
- [Random Variable: What is it in Statistics?](https://www.statisticshowto.com/random-variable/)
- [Maximum Likelihood and Maximum Likelihood Estimation](https://www.statisticshowto.com/maximum-likelihood-estimation/)
- [What is a Parameter in Statistics?](https://www.statisticshowto.com/what-is-a-parameter-in-statistics/)
- [Beta Level: Definition & Examples](https://www.statisticshowto.com/beta-level/)
- [Pairwise Independent, Mutually Independent: Definition, Example](https://www.statisticshowto.com/pairwise-independent-mutually/)
- [Population Mean Definition, Example, Formula](https://www.statisticshowto.com/population-mean/)
- [Dispersion / Measures of Dispersion: Definition](https://www.statisticshowto.com/dispersion/)
- [Serial Correlation / Autocorrelation: Definition, Tests](https://www.statisticshowto.com/serial-correlation-autocorrelation/)
© 2026 [**Statistics How To**](https://www.statisticshowto.com/) \| [About Us](https://www.statisticshowto.com/contact/) \| [Privacy Policy](https://www.statisticshowto.com/privacy-policy/) \| [Terms of Use](https://www.statisticshowto.com/terms-of-use/) | |||||||||
| Readable Markdown | [Estimators](https://www.statisticshowto.com/estimator/) \> James-Stein Estimator
## What is the James-Stein Estimator?
It’s common in statistics to take averages to make predictions. For example, the [sample mean](https://www.statisticshowto.com/probability-and-statistics/statistics-definitions/sample-mean/) (the [average](https://www.statisticshowto.com/arithmetic-mean/) score from all samples) is used as an estimator for the [population mean](https://www.statisticshowto.com/population-mean/). **James-Stein estimators** improve upon these averages by [shrinking](https://www.statisticshowto.com/shrinkage-estimator/) them towards a more central average. The technique is named after Charles Stein and Willard James, who simplified Stein’s original 1956 method.
## Calculations
The basic steps are:
1. Calculate the sample mean (X̄).
2. “Shrink” individual scores towards (X̄); Reduce larger values and increase smaller values. **Each of these individual shrunk values is a James-Stein estimator,** z.
The basic formula for the James-Stein estimator is:
**z = x̄ + c(y – x̄)**
Where:
- (y – x̄) = difference between an individual score and the sample mean,
- c = a shrinking factor.
**Other formulas exist, but they all have the shrinking factor in common.** For example, instead of the sample mean you could use the mean from a [prior distribution](https://www.statisticshowto.com/prior-distribution/) (*m*). In that case, ȳ could be replaced by *m*. The shrinking factor’s value is calculate after collecting the sample data and is given by the formula:
[](https://www.statisticshowto.com/wp-content/uploads/2016/10/shrinking-factor-james-stein-estimator.png)
Where:
- x = individual values,
- x̄ = sample mean,
- k = number of unknown means (must be 2 or more),
- σ2 = [variance](https://www.statisticshowto.com/probability-and-statistics/variance/).
The shrinking factor’s value should be less than 1. For example, a value of .3 would shrink values by about 70 percent.
## James-Stein Estimators vs. Sample Means
The James-Stein estimator is a significant departure from the “traditional” school of thought which states that the sample mean is the best estimator for the population mean. Stein and James proved that a better estimator than the “perfect” estimator exists, which seems to be somewhat of a paradox. However, the James-Stein estimator outperforms the sample mean when there are *several* unknown population means — not just one. The means do not have to be related, so they have to be carefully chosen. **Combining completely unrelated means will give you a result — but it will be a nonsensical one.** Bradley Efron and Carl Morris (1977) offer the extreme example of combining batting averages in baseball and proportions of imported cars; You can calculate a mean for these, but it will make no sense at all.
## References
Efron, B. and Morris, C. (1977), “Stein’s Paradox in Statistics.” Scientific American. 236 (5): 119–127
James, W., and Stein, C., (1961). “Estimation with Quadratic Loss.” Proceedings of the Fourth Berkeley Symposium, Vol. 1 (Berkeley, California: University of California Press), pp. 361-379.
Stein C. (1956). “Inadmissibility of the usual estimator for the mean of a [multivariate normal distribution](https://www.statisticshowto.com/bivariate-normal-distribution/)”. Proceedings of the Third Berkeley Symposium on Mathematical Statistics and Probability. Vol. 1. University of California Press; Berkeley, CA, USA: pp. 197–208
**Comments? Need to post a correction?** Please [***Contact Us***](https://www.statisticshowto.com/contact/). | |||||||||
| ML Classification | ||||||||||
| ML Categories |
Raw JSON{
"/Science": 925,
"/Science/Mathematics": 915,
"/Science/Mathematics/Statistics": 911
} | |||||||||
| ML Page Types |
Raw JSON{
"/Article": 993,
"/Article/Definitions": 744
} | |||||||||
| ML Intent Types |
Raw JSON{
"Informational": 999
} | |||||||||
| Content Metadata | ||||||||||
| Language | en-us | |||||||||
| Author | null | |||||||||
| Publish Time | 2016-10-23 13:49:04 (9 years ago) | |||||||||
| Original Publish Time | 2016-10-23 13:49:04 (9 years ago) | |||||||||
| Republished | No | |||||||||
| Word Count (Total) | 849 | |||||||||
| Word Count (Content) | 473 | |||||||||
| Links | ||||||||||
| External Links | 2 | |||||||||
| Internal Links | 61 | |||||||||
| Technical SEO | ||||||||||
| Meta Nofollow | No | |||||||||
| Meta Noarchive | No | |||||||||
| JS Rendered | Yes | |||||||||
| Redirect Target | null | |||||||||
| Performance | ||||||||||
| Download Time (ms) | 416 | |||||||||
| TTFB (ms) | 415 | |||||||||
| Download Size (bytes) | 17,015 | |||||||||
| Shard | 150 (laksa) | |||||||||
| Root Hash | 12746512124316119150 | |||||||||
| Unparsed URL | com,statisticshowto!www,/james-stein-estimator/ s443 | |||||||||