ℹ️ Skipped - page is already crawled
| Filter | Status | Condition | Details |
|---|---|---|---|
| HTTP status | PASS | download_http_code = 200 | HTTP 200 |
| Age cutoff | PASS | download_stamp > now() - 6 MONTH | 0 months ago |
| History drop | PASS | isNull(history_drop_reason) | No drop reason |
| Spam/ban | PASS | fh_dont_index != 1 AND ml_spam_score = 0 | ml_spam_score=0 |
| Canonical | PASS | meta_canonical IS NULL OR = '' OR = src_unparsed | Not set |
| Property | Value |
|---|---|
| URL | https://www.kff.org/covid-19/growth-in-medicaid-mco-enrollment-during-the-covid-19-pandemic/ |
| Last Crawled | 2026-04-21 01:53:13 (3 hours ago) |
| First Indexed | 2025-08-23 15:34:17 (8 months ago) |
| HTTP Status Code | 200 |
| Meta Title | Growth in Medicaid MCO Enrollment during the COVID-19 Pandemic | KFF |
| Meta Description | This data note looks at state Medicaid managed care enrollment data through March 2021 to assess the impact of the COVID-19 pandemic and economic crisis on Medicaid enrollment. Data collected for 29 states show that the rate of Medicaid managed care enrollment growth was 18.8% when comparing managed care enrollment from March 2020 through March 2021. The rate accelerated compared to March 2020 through September 2020 and reversed the trend seen from March 2019 to March 2020 when aggregate growth declined. |
| Meta Canonical | null |
| Boilerpipe Text | This data note looks at state Medicaid managed care enrollment data through March 2021 to assess the impact of the COVID-19 pandemic and economic crisis on Medicaid enrollment. Data collected for 29 states show that the rate of Medicaid managed care enrollment growth was 18.8% when comparing managed care enrollment from March 2020 through March 2021 (Figure 1). The rate accelerated compared to March 2020 through September 2020 and reversed the trend seen from March 2019 to March 2020 when aggregate growth declined. Recent trends mirror
national enrollment trends
that show enrollment growth has been accelerating since the start of the pandemic. Enrollment growth is primarily attributable to the economic downturn as well as the
“maintenance of eligibility” (MOE) requirements
tied to a 6.2 percentage point increase in the federal match rate (FMAP) authorized by the Families First Coronavirus Response Act (FFCRA) – which prevents states from disenrolling Medicaid beneficiaries if they accept the additional federal funding.
Figure 1: MCO Enrollment Growth Rates: March 2019 – March 2021
Why are recent state MCO enrollment data an important indicator?
Preliminary national Medicaid and CHIP enrollment data collected by the Centers for Medicare and Medicaid Services (CMS) is lagged and currently available through
January 2021
. These data show an increase in Medicaid and CHIP enrollment of 9.3 million or 13.1% from February 2020 through January 2021. Our
KFF Medicaid Managed Care Tracker
tracks Medicaid enrollment in comprehensive Medicaid managed care organizations (MCOs) for all states that make these data publicly available. These data are updated in our tracker annually with March enrollment data, but given changes related to the pandemic we have updated the tracker more frequently to provide a more current look at enrollment trends.
These data are informative as
more than two-thirds
of beneficiaries nationally receive most or all of their care through risk-based MCOs and almost two-thirds of states that contract with MCOs
enroll 75% or more of their Medicaid beneficiaries in MCOs
. Children and nonelderly adults are groups more likely to be affected by changes in the economy and
are also more likely to be enrolled in Medicaid MCOs
. Increased enrollment in MCOs is directly tied to spending without immediate regard to utilization of care. While utilization may be rebounding, it
decreased
during the pandemic for non-urgent care. However, since states make upfront capitation payments to MCOs to provide access to a range of services, analyzing growth in Medicaid MCO enrollment specifically is valuable beyond signaling broader trends in Medicaid enrollment.
What were the trends prior to the pandemic?
Data show that prior to the pandemic, there was an aggregate enrollment decline among reporting states. Specifically, among the 32 states reporting data for March 2019 and March 2020 (of the 40 states, including DC, that contract with MCOs), there was an aggregate decline of 1.3% (Table 1). The median change was essentially flat, showing a 0.4% increase, and there were a relatively equal number of states reporting enrollment gains and enrollment declines (17 and 15 respectively). In 2018, these states accounted for
over 90% of the total share
of enrollment in Medicaid MCOs nationally.
What are the more recent trends?
Negative growth seen from March 2019 to March 2020 reversed and started to accelerate following the start of the COVID-19 pandemic. Among states that reported data in the respective months, when compared to March 2020, states saw an increase in enrollment growth of 4.1% in May 2020, 11.3% in September 2020, 15.3% in December 2020, and 18.8% in March 2021 with similar median growth rates in each time period (Figure 1).
1
Growth rates from March 2020 to March 2021 across states ranged from 9.7% (Tennessee) to 37.0% (Nevada) (Figure 2).
Overall growth in Medicaid enrollment likely reflects both changes in the economy, as people experience income and job loss and become eligible for and enroll in Medicaid coverage, and the FFCRA MOE provisions that require states to ensure continuous coverage for current Medicaid enrollees through the end of the month in which the PHE ends. There is significant variation in MCO enrollment growth across states; however, the variation appears to align with the variation seen in overall Medicaid enrollment growth rates across states.
Figure 2: Percent Growth in Medicaid MCO Enrollment: March 2020 – March 2021
Parent firms, firms that own Medicaid MCOs in two or more states, have seen large increases in both enrollment and market share. As of July 2018 (the latest period with national data) six parent firms – UnitedHealth Group, Centene, Anthem, Molina, Aetna, and WellCare –
accounted for over 47% of all Medicaid MCO enrollment
. In November 2018, Aetna was acquired by CVS and in 2020, WellCare was acquired by Centene. From March 2020 to March 2021, overall Medicaid MCO enrollment increased by around 8.3 million enrollees of which the five parent firms accounted for almost 60% (Figure 3).
Figure 3: Five Fortune 500 firms made almost 60% of the increase in MCO enrollment in 28 states from March 2020 – March 2021
What should we watch going forward?
Last summer, states projected that the MOE requirements and the continued economic downturn would maintain upward pressure on Medicaid enrollment in
FY 2021
(which ends June 30, 2021 for most states). While the current PHE declaration
expires
90 days from April 21, 2021, the Biden Administration has notified states that the PHE will likely remain in place throughout CY 2021 and that states will receive 60 days-notice before the end of the PHE. Additionally, with the Biden administration’s executive order to reopen the enrollment in the federal ACA Marketplace and the “no wrong door” application process,
more individuals may enroll in Medicaid coverage
in the coming months.
2
Enrollment may continue to grow while the MOE remains in place, during ACA open enrollment period that continues through August 15, 2021, and because
enrollment growth may be lagged
and continue even as national indicators begin to improve. This effect was observed following the end of the Great Recession in 2009 when Medicaid
spending and enrollment
continued to grow in 2010 and 2011. Continued growth in MCO enrollment could put pressure on overall state budgets. Therefore, states may want to continue to review utilization patterns as well as options to mitigate risks related to potential overpayments to MCOs.
Table 1: Change in MCO Enrollment, March 2019 – March 2021
Enrollment
Percent Change
State
March 2019
March 2020
September 2020
March 2021
March 2019 – March 2020
March 2020 – September 2020
March 2020 – March 2021
Overall
33 States Reporting
33 States Reporting
34 States Reporting
29 States Reporting
-1.3%
11.3%
18.8%
Arizona
1,514,431
1,517,228
1,692,948
1,800,529
0.2%
11.6%
18.7%
California
10,452,386
10,166,418
10,857,552
11,353,379
-2.7%
6.8%
11.7%
Colorado
110,965
121,435
138,312
151,270
9.4%
13.9%
24.6%
Delaware
200,194
198,477
213,216
NR
-0.9%
7.4%
–
District of Columbia
194,896
182,530
200,049
225,989
-6.3%
9.6%
23.8%
Florida
2,975,428
2,906,434
3,389,302
3,677,298
-2.3%
16.6%
26.5%
Georgia
1,360,907
1,387,641
1,607,743
1,696,673
2.0%
15.9%
22.3%
Hawaii
344,254
340,541
378,100
407,422
-1.1%
11.0%
19.6%
Illinois
2,144,696
2,197,501
2,549,635
2,691,162
2.5%
16.0%
22.5%
Indiana
1,078,209
1,116,114
1,307,448
1,458,069
3.5%
17.1%
30.6%
Iowa
562,432
578,226
635,790
675,185
2.8%
10.0%
16.8%
Kansas
380,022
389,754
419,109
440,681
2.6%
7.5%
13.1%
Kentucky
1,233,360
1,195,787
1,305,929
1,500,939
-3.0%
9.2%
25.5%
Louisiana
1,533,075
NR
1,611,537
1,706,781
–
–
–
Maryland
1,197,185
1,212,628
1,294,436
1,364,957
1.3%
6.7%
12.6%
Massachusetts
695,290
717,029
787,379
NR
3.1%
9.8%
–
Michigan
1,760,122
1,772,762
1,975,341
2,105,078
0.7%
11.4%
18.7%
Minnesota
835,528
841,347
967,376
1,033,751
0.7%
15.0%
22.9%
Mississippi
437,194
431,523
462,070
485,435
-1.3%
7.1%
12.5%
Missouri
676,539
549,116
680,421
744,224
-18.8%
23.9%
35.5%
Nebraska
233,431
232,991
257,589
295,175
-0.2%
10.6%
26.7%
Nevada
466,227
434,252
543,650
595,001
-6.9%
25.2%
37.0%
New Mexico
660,646
674,343
727,421
762,714
2.1%
7.9%
13.1%
New York
4,344,939
4,210,483
4,776,592
5,054,373
-3.1%
13.4%
20.0%
North Dakota
NR
19,814
22,593
NR
–
14.0%
–
Ohio
2,344,075
2,055,454
NR
NR
-12.3%
–
–
Oregon
853,185
898,749
994,631
1,068,563
5.3%
10.7%
18.9%
Pennsylvania
2,274,092
2,235,532
2,461,326
2,626,383
-1.7%
10.1%
17.5%
South Carolina
794,184
788,253
872,574
934,517
-0.7%
10.7%
18.6%
Tennessee
1,389,600
1,421,145
1,493,081
1,558,446
2.3%
5.1%
9.7%
Texas
3,688,147
3,614,486
4,126,940
4,504,285
-2.0%
14.2%
24.6%
Virginia
NR
NR
1,513,132
1,634,786
–
–
–
Washington
1,332,557
1,529,039
1,645,684
1,734,004
14.7%
7.6%
13.4%
West Virginia
390,546
402,303
437,061
457,534
3.0%
8.6%
13.7%
Wisconsin
756,650
766,477
910,960
995,094
1.3%
18.9%
29.8%
NOTES: Select time periods for percent change in MCO enrollment growth rates are shown in this table.“NR” – Not Reported. Methodology for reporting enrollment data varies across states: some states report point in time (PIT) counts while other states report monthly averages.AR, NH, NJ, RI, and UT did not report any data for any time periods.Aggregate growth rates were calculated using states that reported in both periods. From March 2019 – March 2020, 32 states reported in both periods. From March 2020 – September 2020, 32 states reported in both periods. From March – March 2021, 29 states reported in both periods.Data for DC in March 2021 were preliminary. Data for TX were preliminary and February 2021, while data for GA and NE were from January 2021 to represent March 2021 as those were the most up-to-date data available.SOURCES: KFF analysis of state Medicaid managed care enrollment reports.
Growth rates were calculated using states that reported in both periods. From March 2019 – March 2020, 32 states reported in both periods. From March 2020 – May 2020, 27 states reported in both periods. From March 2020 – September 2020, 32 states reported in both periods. From March – December 2020, 30 states reported in both periods. From March 2020 – March 2021, 29 states reported in both periods.
↩︎
The Biden Administration originally reopened enrollment in the Federal ACA Marketplace from February 15 to May 15, 2021 but extended this period through August 15, 2021.
↩︎ |
| Markdown | [Skip to main content](https://www.kff.org/covid-19/growth-in-medicaid-mco-enrollment-during-the-covid-19-pandemic/#main)
The independent source for health policy research, polling, and news.
The independent source for health policy research, polling, and news.
[Subscribe](https://www.kff.org/about-us/email/) [Follow Us](https://www.kff.org/about-us/follow-us/) [Conference Centers](https://www.kff.org/about-us/conference-centers/) [Donate](https://www.kff.org/about-us/support-our-work/)
Search
- [Topics](https://www.kff.org/covid-19/growth-in-medicaid-mco-enrollment-during-the-covid-19-pandemic/)
Back
***
## Topics
***
- [Affordable Care Act](https://www.kff.org/topic/affordable-care-act/)
- [Elections](https://www.kff.org/topic/elections/)
- [Global Health Policy](https://www.kff.org/topic/global-health-policy/)
- [Health Costs](https://www.kff.org/topic/health-costs/)
- [Health Information and Trust](https://www.kff.org/topic/health-information-trust/)
- [HIV/AIDS](https://www.kff.org/topic/hivaids/)
- [Immigrant Health](https://www.kff.org/topic/immigrant-health/)
- [LGBTQ](https://www.kff.org/topic/lgbtq/)
- [Medicaid](https://www.kff.org/topic/medicaid/)
- [Medicare](https://www.kff.org/topic/medicare/)
- [Mental Health](https://www.kff.org/topic/mental-health/)
- [Patient and Consumer Protections](https://www.kff.org/topic/patient-consumer-protections/)
- [Public Opinion](https://www.kff.org/topic/public-opinion/)
- [Private Insurance](https://www.kff.org/topic/private-insurance/)
- [Racial Equity and Health Policy](https://www.kff.org/topic/racial-equity-and-health-policy/)
- [State Health Policy and Data](https://www.kff.org/topic/state-health-policy-data/)
- [Uninsured](https://www.kff.org/topic/uninsured/)
- [Women's Health Policy](https://www.kff.org/topic/womens-health-policy/)
- **FEATURED CONTENT**
- [Health Insurance Marketplace Calculator](https://www.kff.org/interactive/subsidy-calculator/)
- [Peterson-KFF Health System Tracker](https://www.healthsystemtracker.org/)
[Explore all Topics](https://www.kff.org/topics/)
- [Policy Research](https://www.kff.org/covid-19/growth-in-medicaid-mco-enrollment-during-the-covid-19-pandemic/)
Back
***
## Policy Research
***
KFF’s policy research provides facts and analysis on a wide range of policy issues and public programs.
[Explore all Policy Research](https://www.kff.org/policy-research/)
- [Polling](https://www.kff.org/covid-19/growth-in-medicaid-mco-enrollment-during-the-covid-19-pandemic/)
Back
***
## Polling
***
KFF designs, conducts and analyzes original public opinion and survey research on Americans’ attitudes, knowledge, and experiences with the health care system to help amplify the public’s voice in major national debates.
[View all Poll Findings](https://www.kff.org/topic/public-opinion/)
- [Health News](http://www.kffhealthnews.org/)
Back
***
## Health News
***
[KFF Health News](https://kffhealthnews.org/) is a national newsroom that produces in-depth journalism about health issues and is one of the organization’s core operating programs.
[Explore KFF Health News](https://kffhealthnews.org/)
- [Data & Features](https://www.kff.org/covid-19/growth-in-medicaid-mco-enrollment-during-the-covid-19-pandemic/)
Back
***
## Data & Features
***
- **FROM THE CEO**
- [From Drew Altman](https://www.kff.org/from-drew-altman/)
- [Beyond the Data](https://www.kff.org/series/beyond-the-data/)
- **[FEATURES](https://www.kff.org/content-type/feature/?view=grid)**
- [Quick Takes](https://www.kff.org/quick-take/)
- [The Monitor](https://www.kff.org/series/the-monitor/)
- [Health Policy 101](https://www.kff.org/other-health/health-policy-101-introduction/)
- [The Business of Health Podcast with Chip Kahn](https://www.kff.org/series/business-of-health/)
- [The Health Wonk Shop](https://www.kff.org/series/health-wonk-shop/)
- [ACA Health Insurance Marketplace Calculator](https://www.kff.org/interactive/subsidy-calculator/)
- [Employer Health Benefits Survey](https://www.kff.org/health-costs/2025-employer-health-benefits-survey/)
- [Medicaid Budget Survey](https://www.kff.org/medicaid/50-state-medicaid-budget-survey-fy-2024-2025/#2b7b5dc2-25f2-4343-9fbe-915b48e0aef5)
- **[POLLING](https://www.kff.org/topic/public-opinion/)**
- [KFF Health Tracking Poll](https://www.kff.org/series/health-tracking-poll/)
- [Tracking the Public’s Views on the ACA](https://www.kff.org/affordable-care-act/the-publics-views-on-the-aca-tracker/)
- [Polling on Health Information and Trust](https://www.kff.org/public-opinion/kff-polling-on-health-information-and-trust/)
- [Women's Health Survey](https://www.kff.org/womens-health-policy/womens-health-survey/)
- **[FAQS](https://www.kff.org/faqs/)**
- [Health Insurance Marketplace and the ACA](https://www.kff.org/faqs/faqs-health-insurance-marketplace-and-the-aca/)
- [Medicare Open Enrollment](https://www.kff.org/faqs/medicare-open-enrollment-faqs/)
- **[TRACKERS](https://www.kff.org/content-type/tracker/)**
- [ACA Preventive Services Tracker](https://www.kff.org/affordable-care-act/aca-preventive-services-tracker/)
- [Medicaid Waiver Tracker](https://www.kff.org/medicaid/medicaid-waiver-tracker-approved-and-pending-section-1115-waivers-by-state/)
- [Medicaid Work Requirements Tracker](https://www.kff.org/medicaid/medicaid-work-requirements-tracker-overview/)
- [Global Health Budget Tracker](https://www.kff.org/interactive/u-s-global-health-budget-tracker/)
- [Global COVID-19 Tracker](https://www.kff.org/covid-19/global-covid-19-tracker/)
- [Peterson-KFF Health System Tracker](https://www.healthsystemtracker.org/)
- **DASHBOARDS**
- [Abortion in the U.S.](https://www.kff.org/womens-health-policy/abortion-in-the-u-s-dashboard/)
- [Key Data on Health Care by Race and Ethnicity](https://www.kff.org/racial-equity-and-health-policy/key-data-on-health-and-health-care-by-race-and-ethnicity/)
- **DATABASES**
- [State Health Facts](https://www.kff.org/state-health-facts/)
- [Custom State Reports](https://www.kff.org/state-health-facts/custom/)
- **STATE FACT SHEETS**
- [Medicaid Fact Sheets](https://www.kff.org/interactive/medicaid-state-fact-sheets/)
- [Mental Health and Substance Use Fact Sheets](https://www.kff.org/interactive/mental-health-and-substance-use-state-fact-sheets/)
- [State Health Care Snapshots](https://www.kff.org/interactive/election-state-fact-sheets/)
- **STATE PROFILES**
- [State Profiles of Dual-Eligible Individuals](https://www.kff.org/interactive/state-profiles-for-dual-eligible-individuals/united-states/enrollment-and-spending-for-dual-eligible-individuals/)
- [State Profiles of Women’s Health](https://www.kff.org/womens-health-policy/state-profiles-for-womens-health/)
[View all Features](https://www.kff.org/content-type/feature/?view=grid)
- [For Media](https://www.kff.org/covid-19/growth-in-medicaid-mco-enrollment-during-the-covid-19-pandemic/)
Back
***
## For Media
***
- [Media Contacts](https://www.kff.org/media-resources/#media-contacts)
- [Citations and Reprints](https://www.kff.org/about-us/permissions-citations-reprints/)
- [News Releases](https://www.kff.org/content-type/news-release/)
[Explore all Media Resources](https://www.kff.org/about-us/media-resources/)
- [About](https://www.kff.org/covid-19/growth-in-medicaid-mco-enrollment-during-the-covid-19-pandemic/)
Back
***
## About
***
- [About Us](https://www.kff.org/about-us/)
- [Our People](https://www.kff.org/people/)
- [Our Work](https://www.kff.org/about-us/our-programs/)
- [Board of Trustees](https://www.kff.org/about-us/board-of-trustees/)
- [Conference Centers](https://www.kff.org/about-us/conference-centers/)
- [Events](https://www.kff.org/events/)
- [Contact Us](https://www.kff.org/about-us/contact-us/)
- [Join Our Team](https://www.kff.org/about-us/employment-opportunities/)
- **From CEO Drew Altman**
- [President's Message](https://www.kff.org/about-us/presidents-message/)
- [Our Standards & Practices](https://www.kff.org/from-drew-altman/questions-i-get-about-the-standards-and-practices-for-organizations-in-an-era-of-misinformation-and-declining-trust/)
- [Beyond the Data Columns](https://www.kff.org/series/beyond-the-data/)
- [View All](https://www.kff.org/from-drew-altman/)
[About KFF](https://www.kff.org/about-us/)
***
[Follow Us](https://www.kff.org/about-us/follow-us/) [Subscribe](https://www.kff.org/about-us/email/)
Search
[Home](https://www.kff.org/) [Topics](https://www.kff.org/topics/) [COVID-19](https://www.kff.org/topic/covid-19/)
# Growth in Medicaid MCO Enrollment during the COVID-19 Pandemic
Authors: Lina Stolyar, [Elizabeth Hinton](https://www.kff.org/person/elizabeth-hinton/), Natalie Singer, and [Robin Rudowitz](https://www.kff.org/person/robin-rudowitz/)
Published:
Jun 24, 2021
Print
[Email](mailto:?subject=Growth%20in%20Medicaid%20MCO%20Enrollment%20during%20the%20COVID-19%20Pandemic&body=https%3A%2F%2Fwww.kff.org%2Fcovid-19%2Fgrowth-in-medicaid-mco-enrollment-during-the-covid-19-pandemic%2F)
Copy Link
[Add KFF on Google](https://google.com/preferences/source?q=kff.org)
This data note looks at state Medicaid managed care enrollment data through March 2021 to assess the impact of the COVID-19 pandemic and economic crisis on Medicaid enrollment. Data collected for 29 states show that the rate of Medicaid managed care enrollment growth was 18.8% when comparing managed care enrollment from March 2020 through March 2021 (Figure 1). The rate accelerated compared to March 2020 through September 2020 and reversed the trend seen from March 2019 to March 2020 when aggregate growth declined. Recent trends mirror [national enrollment trends](https://www.kff.org/coronavirus-covid-19/issue-brief/analysis-of-recent-national-trends-in-medicaid-and-chip-enrollment/) that show enrollment growth has been accelerating since the start of the pandemic. Enrollment growth is primarily attributable to the economic downturn as well as the [“maintenance of eligibility” (MOE) requirements](https://www.kff.org/medicaid/issue-brief/medicaid-maintenance-of-eligibility-requirements-issues-to-watch-when-they-end/) tied to a 6.2 percentage point increase in the federal match rate (FMAP) authorized by the Families First Coronavirus Response Act (FFCRA) – which prevents states from disenrolling Medicaid beneficiaries if they accept the additional federal funding.

Figure 1: MCO Enrollment Growth Rates: March 2019 – March 2021
**Why are recent state MCO enrollment data an important indicator?** Preliminary national Medicaid and CHIP enrollment data collected by the Centers for Medicare and Medicaid Services (CMS) is lagged and currently available through [January 2021](https://www.kff.org/coronavirus-covid-19/issue-brief/analysis-of-recent-national-trends-in-medicaid-and-chip-enrollment/). These data show an increase in Medicaid and CHIP enrollment of 9.3 million or 13.1% from February 2020 through January 2021. Our [KFF Medicaid Managed Care Tracker](https://www.kff.org/data-collection/medicaid-managed-care-market-tracker/) tracks Medicaid enrollment in comprehensive Medicaid managed care organizations (MCOs) for all states that make these data publicly available. These data are updated in our tracker annually with March enrollment data, but given changes related to the pandemic we have updated the tracker more frequently to provide a more current look at enrollment trends.
These data are informative as [more than two-thirds](https://www.kff.org/other/state-indicator/total-medicaid-mco-enrollment/?currentTimeframe=0&sortModel=%7B%22colId%22:%22Location%22,%22sort%22:%22asc%22%7D) of beneficiaries nationally receive most or all of their care through risk-based MCOs and almost two-thirds of states that contract with MCOs [enroll 75% or more of their Medicaid beneficiaries in MCOs](https://www.kff.org/other/state-indicator/total-medicaid-mco-enrollment/?currentTimeframe=0&sortModel=%7B%22colId%22:%22Location%22,%22sort%22:%22asc%22%7D). Children and nonelderly adults are groups more likely to be affected by changes in the economy and [are also more likely to be enrolled in Medicaid MCOs](https://www.kff.org/medicaid/state-indicator/managed-care-penetration-rates-by-eligibility-group/?currentTimeframe=0&sortModel=%7B%22colId%22:%22Location%22,%22sort%22:%22asc%22%7D). Increased enrollment in MCOs is directly tied to spending without immediate regard to utilization of care. While utilization may be rebounding, it [decreased](https://www.healthsystemtracker.org/chart-collection/how-have-healthcare-utilization-and-spending-changed-so-far-during-the-coronavirus-pandemic/#item-covidcostsuse_marchupdate_7) during the pandemic for non-urgent care. However, since states make upfront capitation payments to MCOs to provide access to a range of services, analyzing growth in Medicaid MCO enrollment specifically is valuable beyond signaling broader trends in Medicaid enrollment.
**What were the trends prior to the pandemic?** Data show that prior to the pandemic, there was an aggregate enrollment decline among reporting states. Specifically, among the 32 states reporting data for March 2019 and March 2020 (of the 40 states, including DC, that contract with MCOs), there was an aggregate decline of 1.3% (Table 1). The median change was essentially flat, showing a 0.4% increase, and there were a relatively equal number of states reporting enrollment gains and enrollment declines (17 and 15 respectively). In 2018, these states accounted for [over 90% of the total share](https://www.medicaid.gov/medicaid/managed-care/downloads/2018-medicaid-managed-care-enrollment-report.pdf) of enrollment in Medicaid MCOs nationally.
**What are the more recent trends?** Negative growth seen from March 2019 to March 2020 reversed and started to accelerate following the start of the COVID-19 pandemic. Among states that reported data in the respective months, when compared to March 2020, states saw an increase in enrollment growth of 4.1% in May 2020, 11.3% in September 2020, 15.3% in December 2020, and 18.8% in March 2021 with similar median growth rates in each time period (Figure 1).[1](https://www.kff.org/covid-19/growth-in-medicaid-mco-enrollment-during-the-covid-19-pandemic/#493912ba-5e3a-4694-aa2f-8d6ba7ee9ffd) Growth rates from March 2020 to March 2021 across states ranged from 9.7% (Tennessee) to 37.0% (Nevada) (Figure 2).
Overall growth in Medicaid enrollment likely reflects both changes in the economy, as people experience income and job loss and become eligible for and enroll in Medicaid coverage, and the FFCRA MOE provisions that require states to ensure continuous coverage for current Medicaid enrollees through the end of the month in which the PHE ends. There is significant variation in MCO enrollment growth across states; however, the variation appears to align with the variation seen in overall Medicaid enrollment growth rates across states.

Figure 2: Percent Growth in Medicaid MCO Enrollment: March 2020 – March 2021
Parent firms, firms that own Medicaid MCOs in two or more states, have seen large increases in both enrollment and market share. As of July 2018 (the latest period with national data) six parent firms – UnitedHealth Group, Centene, Anthem, Molina, Aetna, and WellCare – [accounted for over 47% of all Medicaid MCO enrollment](https://www.kff.org/medicaid/issue-brief/10-things-to-know-about-medicaid-managed-care/). In November 2018, Aetna was acquired by CVS and in 2020, WellCare was acquired by Centene. From March 2020 to March 2021, overall Medicaid MCO enrollment increased by around 8.3 million enrollees of which the five parent firms accounted for almost 60% (Figure 3).
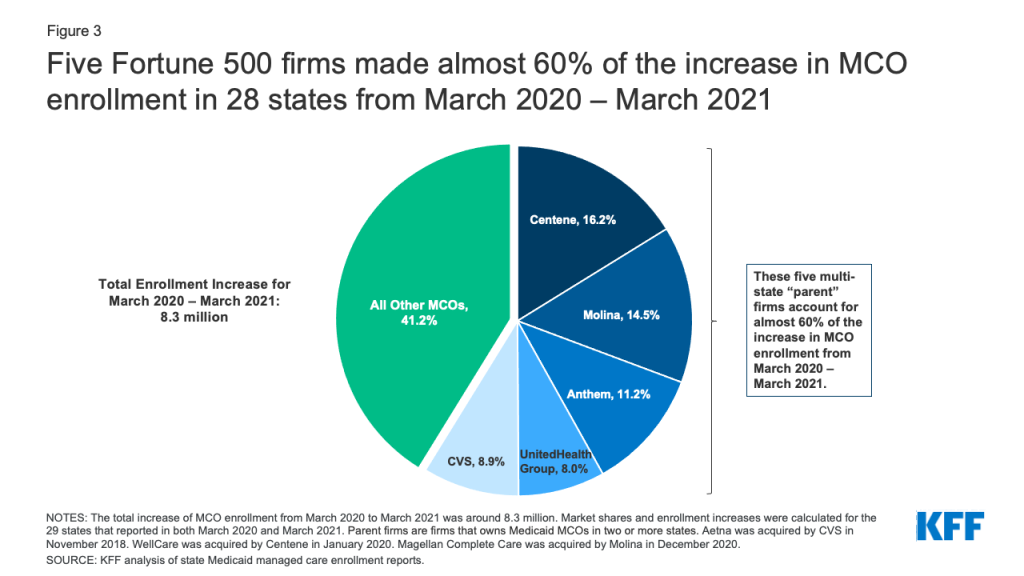
Figure 3: Five Fortune 500 firms made almost 60% of the increase in MCO enrollment in 28 states from March 2020 – March 2021
**What should we watch going forward?** Last summer, states projected that the MOE requirements and the continued economic downturn would maintain upward pressure on Medicaid enrollment in [FY 2021](https://www.kff.org/medicaid/issue-brief/medicaid-enrollment-spending-growth-fy-2020-2021/) (which ends June 30, 2021 for most states). While the current PHE declaration [expires](https://www.phe.gov/emergency/news/healthactions/phe/Pages/COVID-15April2021.aspx) 90 days from April 21, 2021, the Biden Administration has notified states that the PHE will likely remain in place throughout CY 2021 and that states will receive 60 days-notice before the end of the PHE. Additionally, with the Biden administration’s executive order to reopen the enrollment in the federal ACA Marketplace and the “no wrong door” application process, [more individuals may enroll in Medicaid coverage](https://www.kff.org/policy-watch/aca-open-enrollment-matters-for-medicaid-coverage-too/) in the coming months.[2](https://www.kff.org/covid-19/growth-in-medicaid-mco-enrollment-during-the-covid-19-pandemic/#ea9d6ceb-6924-43c7-87a8-978cc09032f1) Enrollment may continue to grow while the MOE remains in place, during ACA open enrollment period that continues through August 15, 2021, and because [enrollment growth may be lagged](https://www.healthaffairs.org/do/10.1377/hblog20200806.165269/full/) and continue even as national indicators begin to improve. This effect was observed following the end of the Great Recession in 2009 when Medicaid [spending and enrollment](https://www.kff.org/medicaid/issue-brief/medicaid-enrollment-spending-growth-fy-2020-2021/#:~:text=Across%20all%20reporting%20states%2C%20states,expenditure%20growth%20in%20FY%202021.) continued to grow in 2010 and 2011. Continued growth in MCO enrollment could put pressure on overall state budgets. Therefore, states may want to continue to review utilization patterns as well as options to mitigate risks related to potential overpayments to MCOs.
| | | | | | | | |
|---|---|---|---|---|---|---|---|
| Table 1: Change in MCO Enrollment, March 2019 – March 2021 | | | | | | | |
| | **Enrollment** | **Percent Change** | | | | | |
| **State** | **March 2019** | **March 2020** | **September 2020** | **March 2021** | **March 2019 – March 2020** | **March 2020 – September 2020** | **March 2020 – March 2021** |
| Overall | 33 States Reporting | 33 States Reporting | 34 States Reporting | 29 States Reporting | \-1.3% | 11\.3% | 18\.8% |
| Arizona | 1,514,431 | 1,517,228 | 1,692,948 | 1,800,529 | 0\.2% | 11\.6% | 18\.7% |
| California | 10,452,386 | 10,166,418 | 10,857,552 | 11,353,379 | \-2.7% | 6\.8% | 11\.7% |
| Colorado | 110,965 | 121,435 | 138,312 | 151,270 | 9\.4% | 13\.9% | 24\.6% |
| Delaware | 200,194 | 198,477 | 213,216 | NR | \-0.9% | 7\.4% | – |
| District of Columbia | 194,896 | 182,530 | 200,049 | 225,989 | \-6.3% | 9\.6% | 23\.8% |
| Florida | 2,975,428 | 2,906,434 | 3,389,302 | 3,677,298 | \-2.3% | 16\.6% | 26\.5% |
| Georgia | 1,360,907 | 1,387,641 | 1,607,743 | 1,696,673 | 2\.0% | 15\.9% | 22\.3% |
| Hawaii | 344,254 | 340,541 | 378,100 | 407,422 | \-1.1% | 11\.0% | 19\.6% |
| Illinois | 2,144,696 | 2,197,501 | 2,549,635 | 2,691,162 | 2\.5% | 16\.0% | 22\.5% |
| Indiana | 1,078,209 | 1,116,114 | 1,307,448 | 1,458,069 | 3\.5% | 17\.1% | 30\.6% |
| Iowa | 562,432 | 578,226 | 635,790 | 675,185 | 2\.8% | 10\.0% | 16\.8% |
| Kansas | 380,022 | 389,754 | 419,109 | 440,681 | 2\.6% | 7\.5% | 13\.1% |
| Kentucky | 1,233,360 | 1,195,787 | 1,305,929 | 1,500,939 | \-3.0% | 9\.2% | 25\.5% |
| Louisiana | 1,533,075 | NR | 1,611,537 | 1,706,781 | – | – | – |
| Maryland | 1,197,185 | 1,212,628 | 1,294,436 | 1,364,957 | 1\.3% | 6\.7% | 12\.6% |
| Massachusetts | 695,290 | 717,029 | 787,379 | NR | 3\.1% | 9\.8% | – |
| Michigan | 1,760,122 | 1,772,762 | 1,975,341 | 2,105,078 | 0\.7% | 11\.4% | 18\.7% |
| Minnesota | 835,528 | 841,347 | 967,376 | 1,033,751 | 0\.7% | 15\.0% | 22\.9% |
| Mississippi | 437,194 | 431,523 | 462,070 | 485,435 | \-1.3% | 7\.1% | 12\.5% |
| Missouri | 676,539 | 549,116 | 680,421 | 744,224 | \-18.8% | 23\.9% | 35\.5% |
| Nebraska | 233,431 | 232,991 | 257,589 | 295,175 | \-0.2% | 10\.6% | 26\.7% |
| Nevada | 466,227 | 434,252 | 543,650 | 595,001 | \-6.9% | 25\.2% | 37\.0% |
| New Mexico | 660,646 | 674,343 | 727,421 | 762,714 | 2\.1% | 7\.9% | 13\.1% |
| New York | 4,344,939 | 4,210,483 | 4,776,592 | 5,054,373 | \-3.1% | 13\.4% | 20\.0% |
| North Dakota | NR | 19,814 | 22,593 | NR | – | 14\.0% | – |
| Ohio | 2,344,075 | 2,055,454 | NR | NR | \-12.3% | – | – |
| Oregon | 853,185 | 898,749 | 994,631 | 1,068,563 | 5\.3% | 10\.7% | 18\.9% |
| Pennsylvania | 2,274,092 | 2,235,532 | 2,461,326 | 2,626,383 | \-1.7% | 10\.1% | 17\.5% |
| South Carolina | 794,184 | 788,253 | 872,574 | 934,517 | \-0.7% | 10\.7% | 18\.6% |
| Tennessee | 1,389,600 | 1,421,145 | 1,493,081 | 1,558,446 | 2\.3% | 5\.1% | 9\.7% |
| Texas | 3,688,147 | 3,614,486 | 4,126,940 | 4,504,285 | \-2.0% | 14\.2% | 24\.6% |
| Virginia | NR | NR | 1,513,132 | 1,634,786 | – | – | – |
| Washington | 1,332,557 | 1,529,039 | 1,645,684 | 1,734,004 | 14\.7% | 7\.6% | 13\.4% |
| West Virginia | 390,546 | 402,303 | 437,061 | 457,534 | 3\.0% | 8\.6% | 13\.7% |
| Wisconsin | 756,650 | 766,477 | 910,960 | 995,094 | 1\.3% | 18\.9% | 29\.8% |
| NOTES: Select time periods for percent change in MCO enrollment growth rates are shown in this table.“NR” – Not Reported. Methodology for reporting enrollment data varies across states: some states report point in time (PIT) counts while other states report monthly averages.AR, NH, NJ, RI, and UT did not report any data for any time periods.Aggregate growth rates were calculated using states that reported in both periods. From March 2019 – March 2020, 32 states reported in both periods. From March 2020 – September 2020, 32 states reported in both periods. From March – March 2021, 29 states reported in both periods.Data for DC in March 2021 were preliminary. Data for TX were preliminary and February 2021, while data for GA and NE were from January 2021 to represent March 2021 as those were the most up-to-date data available.SOURCES: KFF analysis of state Medicaid managed care enrollment reports. | | | | | | | |
1. Growth rates were calculated using states that reported in both periods. From March 2019 – March 2020, 32 states reported in both periods. From March 2020 – May 2020, 27 states reported in both periods. From March 2020 – September 2020, 32 states reported in both periods. From March – December 2020, 30 states reported in both periods. From March 2020 – March 2021, 29 states reported in both periods. [↩︎](https://www.kff.org/covid-19/growth-in-medicaid-mco-enrollment-during-the-covid-19-pandemic/#493912ba-5e3a-4694-aa2f-8d6ba7ee9ffd-link)
2. The Biden Administration originally reopened enrollment in the Federal ACA Marketplace from February 15 to May 15, 2021 but extended this period through August 15, 2021. [↩︎](https://www.kff.org/covid-19/growth-in-medicaid-mco-enrollment-during-the-covid-19-pandemic/#ea9d6ceb-6924-43c7-87a8-978cc09032f1-link)
More On
[COVID-19](https://www.kff.org/topic/covid-19/) [Medicaid](https://www.kff.org/topic/medicaid/) [Enrollment](https://www.kff.org/tag/enrollment/) [Managed Care](https://www.kff.org/tag/managed-care/)
## Also of Interest
### [Medicaid Managed Care Reporting and Transparency: Managed Care Program Annual Reports](https://www.kff.org/medicaid/medicaid-managed-care-reporting-and-transparency-managed-care-program-annual-reports/)
### [10 Things to Know About Medicaid Managed Care](https://www.kff.org/medicaid/10-things-to-know-about-medicaid-managed-care/)
### [A Look at Medicaid Enrollment and Finances of the Five Largest Medicaid Managed Care Plans](https://www.kff.org/medicaid/a-look-at-medicaid-enrollment-and-finances-of-the-five-largest-medicaid-managed-care-plans/)
## More On
- [COVID-19](https://www.kff.org/topic/covid-19/)
- [Medicaid](https://www.kff.org/topic/medicaid/)
- [Enrollment](https://www.kff.org/tag/enrollment/)
- [Managed Care](https://www.kff.org/tag/managed-care/)
[View all Topics](https://www.kff.org/topics/)
- [Policy Research](https://www.kff.org/policy-research/)
- [Polling](https://www.kff.org/topic/public-opinion)
- [Health News](https://www.kffhealthnews.org/)
About Us
- [Conference Centers](https://www.kff.org/about-us/conference-centers/)
- [Join Our Team](https://www.kff.org/about-us/employment-opportunities/)
- [Contact Us](https://www.kff.org/about-us/contact-us/)
- [Follow Us](https://www.kff.org/about-us/follow-us/)
### Sign up for emails
Join our email list for regular updates based on your personal preferences.
[Sign up](https://www.kff.org/about-us/email/)
- [Privacy Policy](https://www.kff.org/about-us/privacy-policy/)
- [Citations and Reprints](https://www.kff.org/about-us/permissions-citations-reprints/)
© 2026 KFF |
| Readable Markdown | This data note looks at state Medicaid managed care enrollment data through March 2021 to assess the impact of the COVID-19 pandemic and economic crisis on Medicaid enrollment. Data collected for 29 states show that the rate of Medicaid managed care enrollment growth was 18.8% when comparing managed care enrollment from March 2020 through March 2021 (Figure 1). The rate accelerated compared to March 2020 through September 2020 and reversed the trend seen from March 2019 to March 2020 when aggregate growth declined. Recent trends mirror [national enrollment trends](https://www.kff.org/coronavirus-covid-19/issue-brief/analysis-of-recent-national-trends-in-medicaid-and-chip-enrollment/) that show enrollment growth has been accelerating since the start of the pandemic. Enrollment growth is primarily attributable to the economic downturn as well as the [“maintenance of eligibility” (MOE) requirements](https://www.kff.org/medicaid/issue-brief/medicaid-maintenance-of-eligibility-requirements-issues-to-watch-when-they-end/) tied to a 6.2 percentage point increase in the federal match rate (FMAP) authorized by the Families First Coronavirus Response Act (FFCRA) – which prevents states from disenrolling Medicaid beneficiaries if they accept the additional federal funding.

Figure 1: MCO Enrollment Growth Rates: March 2019 – March 2021
**Why are recent state MCO enrollment data an important indicator?** Preliminary national Medicaid and CHIP enrollment data collected by the Centers for Medicare and Medicaid Services (CMS) is lagged and currently available through [January 2021](https://www.kff.org/coronavirus-covid-19/issue-brief/analysis-of-recent-national-trends-in-medicaid-and-chip-enrollment/). These data show an increase in Medicaid and CHIP enrollment of 9.3 million or 13.1% from February 2020 through January 2021. Our [KFF Medicaid Managed Care Tracker](https://www.kff.org/data-collection/medicaid-managed-care-market-tracker/) tracks Medicaid enrollment in comprehensive Medicaid managed care organizations (MCOs) for all states that make these data publicly available. These data are updated in our tracker annually with March enrollment data, but given changes related to the pandemic we have updated the tracker more frequently to provide a more current look at enrollment trends.
These data are informative as [more than two-thirds](https://www.kff.org/other/state-indicator/total-medicaid-mco-enrollment/?currentTimeframe=0&sortModel=%7B%22colId%22:%22Location%22,%22sort%22:%22asc%22%7D) of beneficiaries nationally receive most or all of their care through risk-based MCOs and almost two-thirds of states that contract with MCOs [enroll 75% or more of their Medicaid beneficiaries in MCOs](https://www.kff.org/other/state-indicator/total-medicaid-mco-enrollment/?currentTimeframe=0&sortModel=%7B%22colId%22:%22Location%22,%22sort%22:%22asc%22%7D). Children and nonelderly adults are groups more likely to be affected by changes in the economy and [are also more likely to be enrolled in Medicaid MCOs](https://www.kff.org/medicaid/state-indicator/managed-care-penetration-rates-by-eligibility-group/?currentTimeframe=0&sortModel=%7B%22colId%22:%22Location%22,%22sort%22:%22asc%22%7D). Increased enrollment in MCOs is directly tied to spending without immediate regard to utilization of care. While utilization may be rebounding, it [decreased](https://www.healthsystemtracker.org/chart-collection/how-have-healthcare-utilization-and-spending-changed-so-far-during-the-coronavirus-pandemic/#item-covidcostsuse_marchupdate_7) during the pandemic for non-urgent care. However, since states make upfront capitation payments to MCOs to provide access to a range of services, analyzing growth in Medicaid MCO enrollment specifically is valuable beyond signaling broader trends in Medicaid enrollment.
**What were the trends prior to the pandemic?** Data show that prior to the pandemic, there was an aggregate enrollment decline among reporting states. Specifically, among the 32 states reporting data for March 2019 and March 2020 (of the 40 states, including DC, that contract with MCOs), there was an aggregate decline of 1.3% (Table 1). The median change was essentially flat, showing a 0.4% increase, and there were a relatively equal number of states reporting enrollment gains and enrollment declines (17 and 15 respectively). In 2018, these states accounted for [over 90% of the total share](https://www.medicaid.gov/medicaid/managed-care/downloads/2018-medicaid-managed-care-enrollment-report.pdf) of enrollment in Medicaid MCOs nationally.
**What are the more recent trends?** Negative growth seen from March 2019 to March 2020 reversed and started to accelerate following the start of the COVID-19 pandemic. Among states that reported data in the respective months, when compared to March 2020, states saw an increase in enrollment growth of 4.1% in May 2020, 11.3% in September 2020, 15.3% in December 2020, and 18.8% in March 2021 with similar median growth rates in each time period (Figure 1).[1](https://www.kff.org/covid-19/growth-in-medicaid-mco-enrollment-during-the-covid-19-pandemic/#493912ba-5e3a-4694-aa2f-8d6ba7ee9ffd) Growth rates from March 2020 to March 2021 across states ranged from 9.7% (Tennessee) to 37.0% (Nevada) (Figure 2).
Overall growth in Medicaid enrollment likely reflects both changes in the economy, as people experience income and job loss and become eligible for and enroll in Medicaid coverage, and the FFCRA MOE provisions that require states to ensure continuous coverage for current Medicaid enrollees through the end of the month in which the PHE ends. There is significant variation in MCO enrollment growth across states; however, the variation appears to align with the variation seen in overall Medicaid enrollment growth rates across states.

Figure 2: Percent Growth in Medicaid MCO Enrollment: March 2020 – March 2021
Parent firms, firms that own Medicaid MCOs in two or more states, have seen large increases in both enrollment and market share. As of July 2018 (the latest period with national data) six parent firms – UnitedHealth Group, Centene, Anthem, Molina, Aetna, and WellCare – [accounted for over 47% of all Medicaid MCO enrollment](https://www.kff.org/medicaid/issue-brief/10-things-to-know-about-medicaid-managed-care/). In November 2018, Aetna was acquired by CVS and in 2020, WellCare was acquired by Centene. From March 2020 to March 2021, overall Medicaid MCO enrollment increased by around 8.3 million enrollees of which the five parent firms accounted for almost 60% (Figure 3).

Figure 3: Five Fortune 500 firms made almost 60% of the increase in MCO enrollment in 28 states from March 2020 – March 2021
**What should we watch going forward?** Last summer, states projected that the MOE requirements and the continued economic downturn would maintain upward pressure on Medicaid enrollment in [FY 2021](https://www.kff.org/medicaid/issue-brief/medicaid-enrollment-spending-growth-fy-2020-2021/) (which ends June 30, 2021 for most states). While the current PHE declaration [expires](https://www.phe.gov/emergency/news/healthactions/phe/Pages/COVID-15April2021.aspx) 90 days from April 21, 2021, the Biden Administration has notified states that the PHE will likely remain in place throughout CY 2021 and that states will receive 60 days-notice before the end of the PHE. Additionally, with the Biden administration’s executive order to reopen the enrollment in the federal ACA Marketplace and the “no wrong door” application process, [more individuals may enroll in Medicaid coverage](https://www.kff.org/policy-watch/aca-open-enrollment-matters-for-medicaid-coverage-too/) in the coming months.[2](https://www.kff.org/covid-19/growth-in-medicaid-mco-enrollment-during-the-covid-19-pandemic/#ea9d6ceb-6924-43c7-87a8-978cc09032f1) Enrollment may continue to grow while the MOE remains in place, during ACA open enrollment period that continues through August 15, 2021, and because [enrollment growth may be lagged](https://www.healthaffairs.org/do/10.1377/hblog20200806.165269/full/) and continue even as national indicators begin to improve. This effect was observed following the end of the Great Recession in 2009 when Medicaid [spending and enrollment](https://www.kff.org/medicaid/issue-brief/medicaid-enrollment-spending-growth-fy-2020-2021/#:~:text=Across%20all%20reporting%20states%2C%20states,expenditure%20growth%20in%20FY%202021.) continued to grow in 2010 and 2011. Continued growth in MCO enrollment could put pressure on overall state budgets. Therefore, states may want to continue to review utilization patterns as well as options to mitigate risks related to potential overpayments to MCOs.
| | | | | | | | |
|---|---|---|---|---|---|---|---|
| Table 1: Change in MCO Enrollment, March 2019 – March 2021 | | | | | | | |
| | **Enrollment** | **Percent Change** | | | | | |
| **State** | **March 2019** | **March 2020** | **September 2020** | **March 2021** | **March 2019 – March 2020** | **March 2020 – September 2020** | **March 2020 – March 2021** |
| Overall | 33 States Reporting | 33 States Reporting | 34 States Reporting | 29 States Reporting | \-1.3% | 11\.3% | 18\.8% |
| Arizona | 1,514,431 | 1,517,228 | 1,692,948 | 1,800,529 | 0\.2% | 11\.6% | 18\.7% |
| California | 10,452,386 | 10,166,418 | 10,857,552 | 11,353,379 | \-2.7% | 6\.8% | 11\.7% |
| Colorado | 110,965 | 121,435 | 138,312 | 151,270 | 9\.4% | 13\.9% | 24\.6% |
| Delaware | 200,194 | 198,477 | 213,216 | NR | \-0.9% | 7\.4% | – |
| District of Columbia | 194,896 | 182,530 | 200,049 | 225,989 | \-6.3% | 9\.6% | 23\.8% |
| Florida | 2,975,428 | 2,906,434 | 3,389,302 | 3,677,298 | \-2.3% | 16\.6% | 26\.5% |
| Georgia | 1,360,907 | 1,387,641 | 1,607,743 | 1,696,673 | 2\.0% | 15\.9% | 22\.3% |
| Hawaii | 344,254 | 340,541 | 378,100 | 407,422 | \-1.1% | 11\.0% | 19\.6% |
| Illinois | 2,144,696 | 2,197,501 | 2,549,635 | 2,691,162 | 2\.5% | 16\.0% | 22\.5% |
| Indiana | 1,078,209 | 1,116,114 | 1,307,448 | 1,458,069 | 3\.5% | 17\.1% | 30\.6% |
| Iowa | 562,432 | 578,226 | 635,790 | 675,185 | 2\.8% | 10\.0% | 16\.8% |
| Kansas | 380,022 | 389,754 | 419,109 | 440,681 | 2\.6% | 7\.5% | 13\.1% |
| Kentucky | 1,233,360 | 1,195,787 | 1,305,929 | 1,500,939 | \-3.0% | 9\.2% | 25\.5% |
| Louisiana | 1,533,075 | NR | 1,611,537 | 1,706,781 | – | – | – |
| Maryland | 1,197,185 | 1,212,628 | 1,294,436 | 1,364,957 | 1\.3% | 6\.7% | 12\.6% |
| Massachusetts | 695,290 | 717,029 | 787,379 | NR | 3\.1% | 9\.8% | – |
| Michigan | 1,760,122 | 1,772,762 | 1,975,341 | 2,105,078 | 0\.7% | 11\.4% | 18\.7% |
| Minnesota | 835,528 | 841,347 | 967,376 | 1,033,751 | 0\.7% | 15\.0% | 22\.9% |
| Mississippi | 437,194 | 431,523 | 462,070 | 485,435 | \-1.3% | 7\.1% | 12\.5% |
| Missouri | 676,539 | 549,116 | 680,421 | 744,224 | \-18.8% | 23\.9% | 35\.5% |
| Nebraska | 233,431 | 232,991 | 257,589 | 295,175 | \-0.2% | 10\.6% | 26\.7% |
| Nevada | 466,227 | 434,252 | 543,650 | 595,001 | \-6.9% | 25\.2% | 37\.0% |
| New Mexico | 660,646 | 674,343 | 727,421 | 762,714 | 2\.1% | 7\.9% | 13\.1% |
| New York | 4,344,939 | 4,210,483 | 4,776,592 | 5,054,373 | \-3.1% | 13\.4% | 20\.0% |
| North Dakota | NR | 19,814 | 22,593 | NR | – | 14\.0% | – |
| Ohio | 2,344,075 | 2,055,454 | NR | NR | \-12.3% | – | – |
| Oregon | 853,185 | 898,749 | 994,631 | 1,068,563 | 5\.3% | 10\.7% | 18\.9% |
| Pennsylvania | 2,274,092 | 2,235,532 | 2,461,326 | 2,626,383 | \-1.7% | 10\.1% | 17\.5% |
| South Carolina | 794,184 | 788,253 | 872,574 | 934,517 | \-0.7% | 10\.7% | 18\.6% |
| Tennessee | 1,389,600 | 1,421,145 | 1,493,081 | 1,558,446 | 2\.3% | 5\.1% | 9\.7% |
| Texas | 3,688,147 | 3,614,486 | 4,126,940 | 4,504,285 | \-2.0% | 14\.2% | 24\.6% |
| Virginia | NR | NR | 1,513,132 | 1,634,786 | – | – | – |
| Washington | 1,332,557 | 1,529,039 | 1,645,684 | 1,734,004 | 14\.7% | 7\.6% | 13\.4% |
| West Virginia | 390,546 | 402,303 | 437,061 | 457,534 | 3\.0% | 8\.6% | 13\.7% |
| Wisconsin | 756,650 | 766,477 | 910,960 | 995,094 | 1\.3% | 18\.9% | 29\.8% |
| NOTES: Select time periods for percent change in MCO enrollment growth rates are shown in this table.“NR” – Not Reported. Methodology for reporting enrollment data varies across states: some states report point in time (PIT) counts while other states report monthly averages.AR, NH, NJ, RI, and UT did not report any data for any time periods.Aggregate growth rates were calculated using states that reported in both periods. From March 2019 – March 2020, 32 states reported in both periods. From March 2020 – September 2020, 32 states reported in both periods. From March – March 2021, 29 states reported in both periods.Data for DC in March 2021 were preliminary. Data for TX were preliminary and February 2021, while data for GA and NE were from January 2021 to represent March 2021 as those were the most up-to-date data available.SOURCES: KFF analysis of state Medicaid managed care enrollment reports. | | | | | | | |
1. Growth rates were calculated using states that reported in both periods. From March 2019 – March 2020, 32 states reported in both periods. From March 2020 – May 2020, 27 states reported in both periods. From March 2020 – September 2020, 32 states reported in both periods. From March – December 2020, 30 states reported in both periods. From March 2020 – March 2021, 29 states reported in both periods. [↩︎](https://www.kff.org/covid-19/growth-in-medicaid-mco-enrollment-during-the-covid-19-pandemic/#493912ba-5e3a-4694-aa2f-8d6ba7ee9ffd-link)
2. The Biden Administration originally reopened enrollment in the Federal ACA Marketplace from February 15 to May 15, 2021 but extended this period through August 15, 2021. [↩︎](https://www.kff.org/covid-19/growth-in-medicaid-mco-enrollment-during-the-covid-19-pandemic/#ea9d6ceb-6924-43c7-87a8-978cc09032f1-link) |
| Shard | 146 (laksa) |
| Root Hash | 158852913627932146 |
| Unparsed URL | org,kff!www,/covid-19/growth-in-medicaid-mco-enrollment-during-the-covid-19-pandemic/ s443 |