ℹ️ Skipped - page is already crawled
| Filter | Status | Condition | Details |
|---|---|---|---|
| HTTP status | PASS | download_http_code = 200 | HTTP 200 |
| Age cutoff | PASS | download_stamp > now() - 6 MONTH | 0.2 months ago |
| History drop | PASS | isNull(history_drop_reason) | No drop reason |
| Spam/ban | PASS | fh_dont_index != 1 AND ml_spam_score = 0 | ml_spam_score=0 |
| Canonical | PASS | meta_canonical IS NULL OR = '' OR = src_unparsed | Not set |
| Property | Value |
|---|---|
| URL | https://www.icmarkets.com/blog/bollinger-bands/ |
| Last Crawled | 2026-04-03 11:01:56 (5 days ago) |
| First Indexed | 2019-03-28 16:58:59 (7 years ago) |
| HTTP Status Code | 200 |
| Meta Title | Simplify Your Trading with Bollinger Bands | IC Your Trading Edge | Official Blog |
| Meta Description | null |
| Meta Canonical | null |
| Boilerpipe Text | The history of trading bands, envelopes and channels is long and interesting.
In the years since the creation of Bollinger Bands in 1983, a number of adaptive bands were created. Chief among them were Keltner Channels, introduced by Chester Keltner in the 1960s. This technical indicator is similar to Bollinger Bands, though rather than using the standard deviation, Keltner Channels use the Average True Range (ATR) to set channel distance.
Created by John A. Bollinger, Bollinger Bands have undoubtedly stood the test of time and proven to be one of the more robust indicators available in the technical community today.
A recognised trader, multiple books, TV appearances, investments, numerous board memberships with Technical Associations and a research firm, certainly places Bollinger at the top of the pile in the trading arena.
Bollinger Band construction
The structure behind the trading bands is quite straightforward, visually depicted using three lines enveloping market data:
Bollinger Bands are envelopes plotted at a standard deviation level above and below a simple moving average (SMA), usually set to a period of 20 days (approximately the number of trading days in a month). Because the distance of the bands is based on standard deviation, they adjust to volatility swings in the underlying price.
The central line serves as a foundation to create its surrounding bands. Typically, the outer lines are positioned at two standard deviations.
According to Bollinger, approximately 90% of price action occurs between the two bands at 20 periods and two standard deviations.
Should traders feel the need to alter the calculation period and keep the containment percentage constant, however, increasing/decreasing the bandwidth is necessary.
Bandwidth measures the distance between the two bands using the following calculation: BW = (Upper BB – Lower BB) / Moving Average. Shortening the calculation period to 10 days, it is recommended to decrease the bandwidth from 2.0 to 1.9, whereas lengthening the calculation period to 50 days, increasing the bandwidth from 2.0 to 2.1 is suggested.
The many uses Bollinger Bands offer
Identify overbought/oversold markets:
When price action approaches the upper Bollinger Band, the indicator considers this a statistically ‘expensive’ market, or more commonly referred to in the technical world as ‘overbought’. The same can be said for a market testing the lower band, only this position defines a ‘cheap’ market, or ‘oversold’. The logic here comes from the upper and lower bands being positioned two standard deviations from the market average (the mean), which in the case of Bollinger Bands, as emphasised above, is a 20-day simple moving average.
Although relatively straightforward, trading overbought/oversold points in isolation is challenging. Check out the EUR/AUD currency pair (M15 timeframe) posted below, you clearly see instances the upper and lower bands highlighted potential areas to trade (orange and blue arrows), though there are also times (black zones) the candlesticks hugged the upper and lower bands.
While the bands do underline overbought/oversold points, it does not always translate to a trading opportunity. The reason being is trending markets, or extended moves, forces price action to skirt the upper and lower bands.
Recognise
market volatility:
Bollinger Bands provide traders a clear visual of market volatility.
Sometimes referred to as ‘the squeeze’, Bollinger Bands expand on high volatility and contract, or squeeze, on low volatility. Unless you’re a scalper looking to pick off small moves, avoiding environments exhibiting low volatility is likely best, given the limited profit potential.
Below is a typical Bollinger squeeze:
Detect potential breakouts:
Due to the fact volatility generally expands following a period of contraction, identifying possible breakouts using Bollinger Bands is a popular strategy. Traders can visually recognize when an instrument is consolidating on low volatility as the upper and lower bands squeeze – the Bollinger squeeze as briefly featured above.
Not only useful for breakout traders, trend traders also find this technique particularly valuable to ascertain trend strength, offering opportunities to potentially jump aboard a trend or pyramid a current position.
The longer price action remains within its consolidation, the stronger the breakout tends to be.
Methods of confirming a breakout using Bollinger Bands come in many forms. The most obvious is a candle close beyond the outer limits. Some prefer to observe two candle closes, though this would get you in at a worse price and reduce risk/reward.
Not a standalone indicator
Although Bollinger Bands are a favourite among technical analysts, using it alongside additional tools as a basis for a complete trading strategy is highly likely going to improve your bottom line.
As is the case with most technical indicators, making informed trading decisions based on one indicator is a challenge. Some would say impossible. Bollinger considers convergences between Bollinger Bands and technical tools (technical analysis) to be a successful approach.
Implementing trend analysis
, alongside the Bollinger Bands, has, for some traders, proven a fruitful method. If a market is trending north for an extended period of time, initiating short positions is a chancy play; even if price is touching the upper Bollinger band (overbought) or has broken the lower Bollinger Band (indicating a breakout to the downside may occur).
Below is a good example of a trending currency pair converging with a trend line support at the lower Bollinger Band during a time the indicator was emphasizing low market volatility. Also note, there was a candlestick close to the downside through the lower edge of the Bollinger Band marked with a blue arrow. Entering short on this candle close as a breakout setup, in this situation, meant selling within a trending market that was approaching a trend line support. As you can see, in conditions like this, trend analysis saved an unnecessary loss.
Support and resistance
also plays a key part in determining the validity of a Bollinger Band signal. Looking at the same chart (posted below); there was a clear level of resistance-turned support in view. By selling the initial breakout (marked with a blue arrow on the chart above) it entailed shorting into not only the immediate trend, a clear trend line support but also a notable support level!
If a support level, a trend line support and trend direction is not enough to confirm a long bias from the lower Bollinger Band, maybe having a 61.8% Fibonacci support level fuse with the area may help:
What you effectively did here was take the Bollinger bands as a foundation and shape a buy zone (marked in green) using multiple points of confluence. You also avoided a potential loss.
Of course, not all trades will deliver reversals quite as large as the one depicted above, though very often Bollinger bands supported with additional technical confirmation will produce a sizeable bounce.
Bottom line
Considering most trading platforms offer in excess of 100 indicators, using technical analysis as a mode to trade is difficult for a lot of newer traders. Using the Bollinger Bands as a footing can simplify your trading strategy. Besides the indicator classifying overbought and oversold points in the market, it recognises market volatility and detects possible breakouts. This – coupled with additional technical tools like the ones underlined above – makes it a formidable methodology.
With that being the case, feel free to open a demo account here:
https://www.icmarkets.com/en/open-trading-account/demo
and road-test Bollinger Bands for yourself. You may just be surprised at how effective your trading becomes! |
| Markdown | - [Client](https://www.icmarkets.com/global)
- [Partners](https://www.icmarketspartners.com/)
- [NEW IC Social](https://www.icmarkets.com/global/en/social-trading-tools/social-trading-mobile-app)
- [WebTrader](https://webtrader-sc.icmarkets.com/)
- [Start Trading](https://www.icmarkets.com/global/en/open-trading-account/live)
- [Try a Free Demo](https://www.icmarkets.com/global/en/open-trading-account/demo)
- [Contact Us](https://www.icmarkets.com/global/en/company/contact-us)
[](https://www.icmarkets.com/blog/)
- [News](https://www.icmarkets.com/blog/bollinger-bands/)
- [Forex News: Daily](https://www.icmarkets.com/blog/category/forex-news-daily/)
- [Fundamental Analysis](https://www.icmarkets.com/blog/category/fundamental-analysis/)
- [General Market Analysis](https://www.icmarkets.com/blog/category/general-market-analysis/)
- [Market Analysis](https://www.icmarkets.com/blog/category/market-analysis/)
- [Market News](https://www.icmarkets.com/blog/category/market-news/)
- [Technical Analysis](https://www.icmarkets.com/blog/category/technical-analysis/)
- [Education](https://www.icmarkets.com/blog/bollinger-bands/)
- [Forex Trading 101](https://www.icmarkets.com/blog/category/forex-trading-101/)
- [Fundamental Analysis 101](https://www.icmarkets.com/blog/category/fundamental-analysis-101/)
- [Risk Management 101](https://www.icmarkets.com/blog/category/risk-management-101/)
- [Technical Analysis 101](https://www.icmarkets.com/blog/category/technical-analysis-101/)
- [Trading Plan 101](https://www.icmarkets.com/blog/category/trading-plan-101/)
- [Trading Psychology 101](https://www.icmarkets.com/blog/category/trading-psychology-101/)
- [Podcast](https://www.icmarkets.com/blog/category/ic-your-trade/)
- [Webinars](https://www.icmarkets.com/go/webinars/upcoming)
- [Trading Data](https://www.icmarkets.com/blog/bollinger-bands/)
- [Scheduled Server Maintenance](https://www.icmarkets.com/blog/scheduled-server-maintenance-april-2026/)
- [Ex Dividends Indices](https://www.icmarkets.com/blog/category/ex-dividends-indices/)
- [Ex Dividend Stocks](https://www.icmarkets.com/blog/ex-dividend-stocks/)
- [Earning Report](https://www.icmarkets.com/blog/earning-report/)
- [About](https://www.icmarkets.com/blog/bollinger-bands/)
- [Trading Schedule](https://www.icmarkets.com/blog/category/trading-schedule/)
- [Press Releases](https://www.icmarkets.com/blog/category/press-releases/)
- [Contact Us](https://www.icmarkets.com/global/en/company/contact-us)
[Client Login](https://secure.icmarkets.com/)
Browse
##### ICMarket
- [News](https://www.icmarkets.com/blog/bollinger-bands/)
- [Forex News: Daily](https://www.icmarkets.com/blog/category/forex-news-daily/)
- [Fundamental Analysis](https://www.icmarkets.com/blog/category/fundamental-analysis/)
- [General Market Analysis](https://www.icmarkets.com/blog/category/general-market-analysis/)
- [Market Analysis](https://www.icmarkets.com/blog/category/market-analysis/)
- [Market News](https://www.icmarkets.com/blog/category/market-news/)
- [Technical Analysis](https://www.icmarkets.com/blog/category/technical-analysis/)
- [Education](https://www.icmarkets.com/blog/bollinger-bands/)
- [Forex Trading 101](https://www.icmarkets.com/blog/category/forex-trading-101/)
- [Fundamental Analysis 101](https://www.icmarkets.com/blog/category/fundamental-analysis-101/)
- [Risk Management 101](https://www.icmarkets.com/blog/category/risk-management-101/)
- [Technical Analysis 101](https://www.icmarkets.com/blog/category/technical-analysis-101/)
- [Trading Plan 101](https://www.icmarkets.com/blog/category/trading-plan-101/)
- [Trading Psychology 101](https://www.icmarkets.com/blog/category/trading-psychology-101/)
- [Podcast](https://www.icmarkets.com/blog/category/ic-your-trade/)
- [Webinars](https://www.icmarkets.com/go/webinars/upcoming)
- [Trading Data](https://www.icmarkets.com/blog/bollinger-bands/)
- [Scheduled Server Maintenance](https://www.icmarkets.com/blog/scheduled-server-maintenance-april-2026/)
- [Ex Dividends Indices](https://www.icmarkets.com/blog/category/ex-dividends-indices/)
- [Ex Dividend Stocks](https://www.icmarkets.com/blog/ex-dividend-stocks/)
- [Earning Report](https://www.icmarkets.com/blog/earning-report/)
- [About](https://www.icmarkets.com/blog/bollinger-bands/)
- [Trading Schedule](https://www.icmarkets.com/blog/category/trading-schedule/)
- [Press Releases](https://www.icmarkets.com/blog/category/press-releases/)
- [Contact Us](https://www.icmarkets.com/global/en/company/contact-us)
[Home](https://www.icmarkets.com/blog/) [Forex Trading 101](https://www.icmarkets.com/blog/category/forex-trading-101/)
## [Forex Trading 101](https://www.icmarkets.com/blog/category/forex-trading-101/)
IC •
Mar 29, 2019
# Simplify Your Trading with Bollinger Bands
The history of trading bands, envelopes and channels is long and interesting.
In the years since the creation of Bollinger Bands in 1983, a number of adaptive bands were created. Chief among them were Keltner Channels, introduced by Chester Keltner in the 1960s. This technical indicator is similar to Bollinger Bands, though rather than using the standard deviation, Keltner Channels use the Average True Range (ATR) to set channel distance.
Created by John A. Bollinger, Bollinger Bands have undoubtedly stood the test of time and proven to be one of the more robust indicators available in the technical community today.
A recognised trader, multiple books, TV appearances, investments, numerous board memberships with Technical Associations and a research firm, certainly places Bollinger at the top of the pile in the trading arena.
## **Bollinger Band construction**
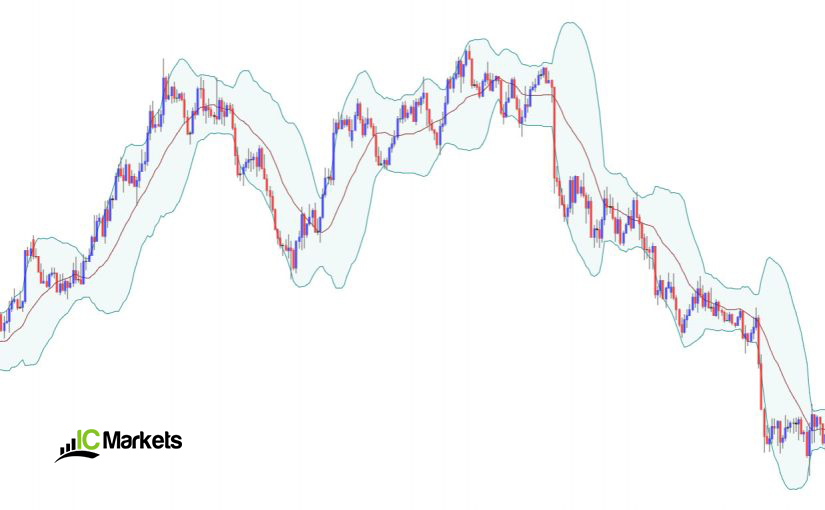
The structure behind the trading bands is quite straightforward, visually depicted using three lines enveloping market data:
Bollinger Bands are envelopes plotted at a standard deviation level above and below a simple moving average (SMA), usually set to a period of 20 days (approximately the number of trading days in a month). Because the distance of the bands is based on standard deviation, they adjust to volatility swings in the underlying price.
The central line serves as a foundation to create its surrounding bands. Typically, the outer lines are positioned at two standard deviations.
According to Bollinger, approximately 90% of price action occurs between the two bands at 20 periods and two standard deviations.
Should traders feel the need to alter the calculation period and keep the containment percentage constant, however, increasing/decreasing the bandwidth is necessary.
Bandwidth measures the distance between the two bands using the following calculation: BW = (Upper BB – Lower BB) / Moving Average. Shortening the calculation period to 10 days, it is recommended to decrease the bandwidth from 2.0 to 1.9, whereas lengthening the calculation period to 50 days, increasing the bandwidth from 2.0 to 2.1 is suggested.
## **The many uses Bollinger Bands offer**
**Identify overbought/oversold markets:**
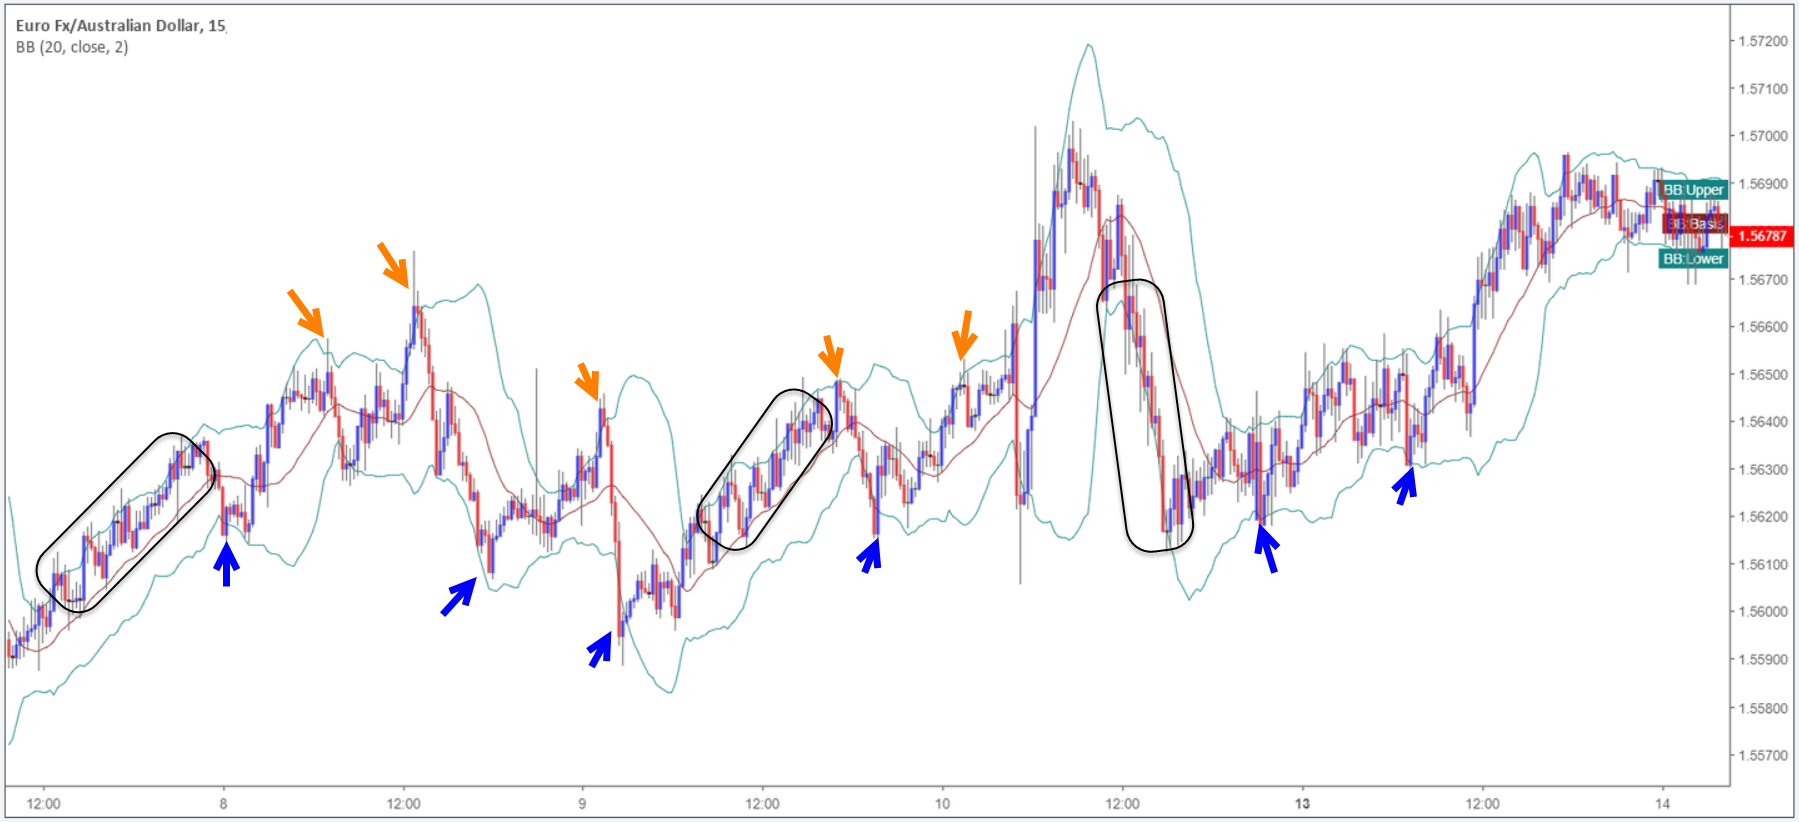
When price action approaches the upper Bollinger Band, the indicator considers this a statistically ‘expensive’ market, or more commonly referred to in the technical world as ‘overbought’. The same can be said for a market testing the lower band, only this position defines a ‘cheap’ market, or ‘oversold’. The logic here comes from the upper and lower bands being positioned two standard deviations from the market average (the mean), which in the case of Bollinger Bands, as emphasised above, is a 20-day simple moving average.
Although relatively straightforward, trading overbought/oversold points in isolation is challenging. Check out the EUR/AUD currency pair (M15 timeframe) posted below, you clearly see instances the upper and lower bands highlighted potential areas to trade (orange and blue arrows), though there are also times (black zones) the candlesticks hugged the upper and lower bands.
While the bands do underline overbought/oversold points, it does not always translate to a trading opportunity. The reason being is trending markets, or extended moves, forces price action to skirt the upper and lower bands.
**Recognise** **market volatility:**
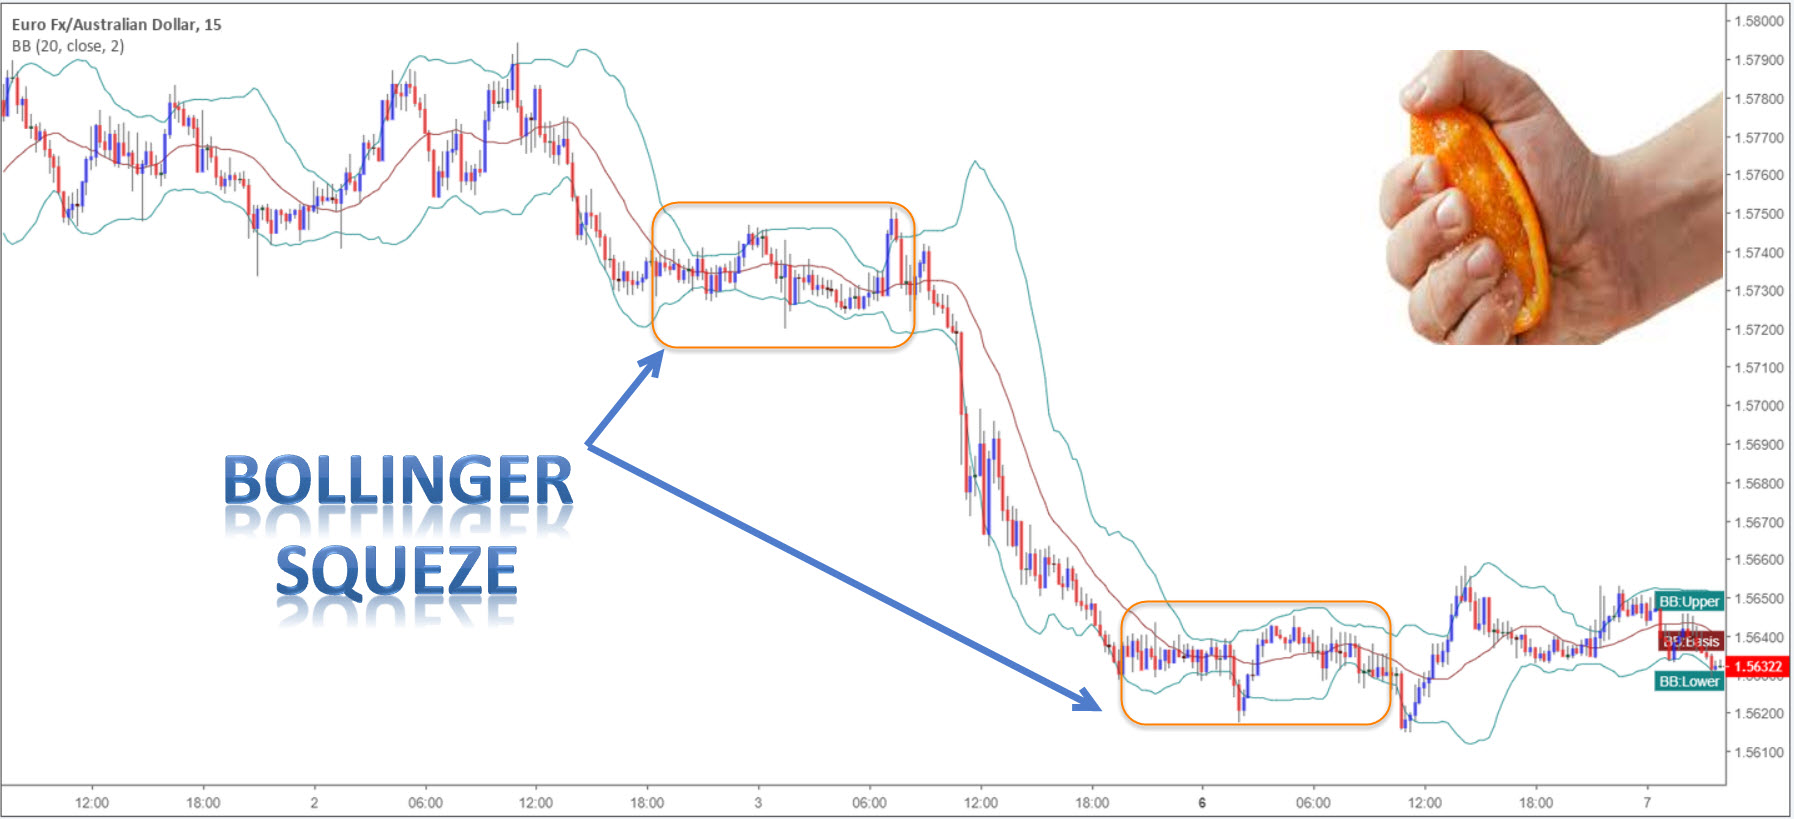
Bollinger Bands provide traders a clear visual of market volatility.
Sometimes referred to as ‘the squeeze’, Bollinger Bands expand on high volatility and contract, or squeeze, on low volatility. Unless you’re a scalper looking to pick off small moves, avoiding environments exhibiting low volatility is likely best, given the limited profit potential.
Below is a typical Bollinger squeeze:
**Detect potential breakouts:**
Due to the fact volatility generally expands following a period of contraction, identifying possible breakouts using Bollinger Bands is a popular strategy. Traders can visually recognize when an instrument is consolidating on low volatility as the upper and lower bands squeeze – the Bollinger squeeze as briefly featured above.
Not only useful for breakout traders, trend traders also find this technique particularly valuable to ascertain trend strength, offering opportunities to potentially jump aboard a trend or pyramid a current position.
The longer price action remains within its consolidation, the stronger the breakout tends to be.
Methods of confirming a breakout using Bollinger Bands come in many forms. The most obvious is a candle close beyond the outer limits. Some prefer to observe two candle closes, though this would get you in at a worse price and reduce risk/reward.
## Not a standalone indicator
Although Bollinger Bands are a favourite among technical analysts, using it alongside additional tools as a basis for a complete trading strategy is highly likely going to improve your bottom line.
As is the case with most technical indicators, making informed trading decisions based on one indicator is a challenge. Some would say impossible. Bollinger considers convergences between Bollinger Bands and technical tools (technical analysis) to be a successful approach.
**Implementing trend analysis**, alongside the Bollinger Bands, has, for some traders, proven a fruitful method. If a market is trending north for an extended period of time, initiating short positions is a chancy play; even if price is touching the upper Bollinger band (overbought) or has broken the lower Bollinger Band (indicating a breakout to the downside may occur).
Below is a good example of a trending currency pair converging with a trend line support at the lower Bollinger Band during a time the indicator was emphasizing low market volatility. Also note, there was a candlestick close to the downside through the lower edge of the Bollinger Band marked with a blue arrow. Entering short on this candle close as a breakout setup, in this situation, meant selling within a trending market that was approaching a trend line support. As you can see, in conditions like this, trend analysis saved an unnecessary loss.
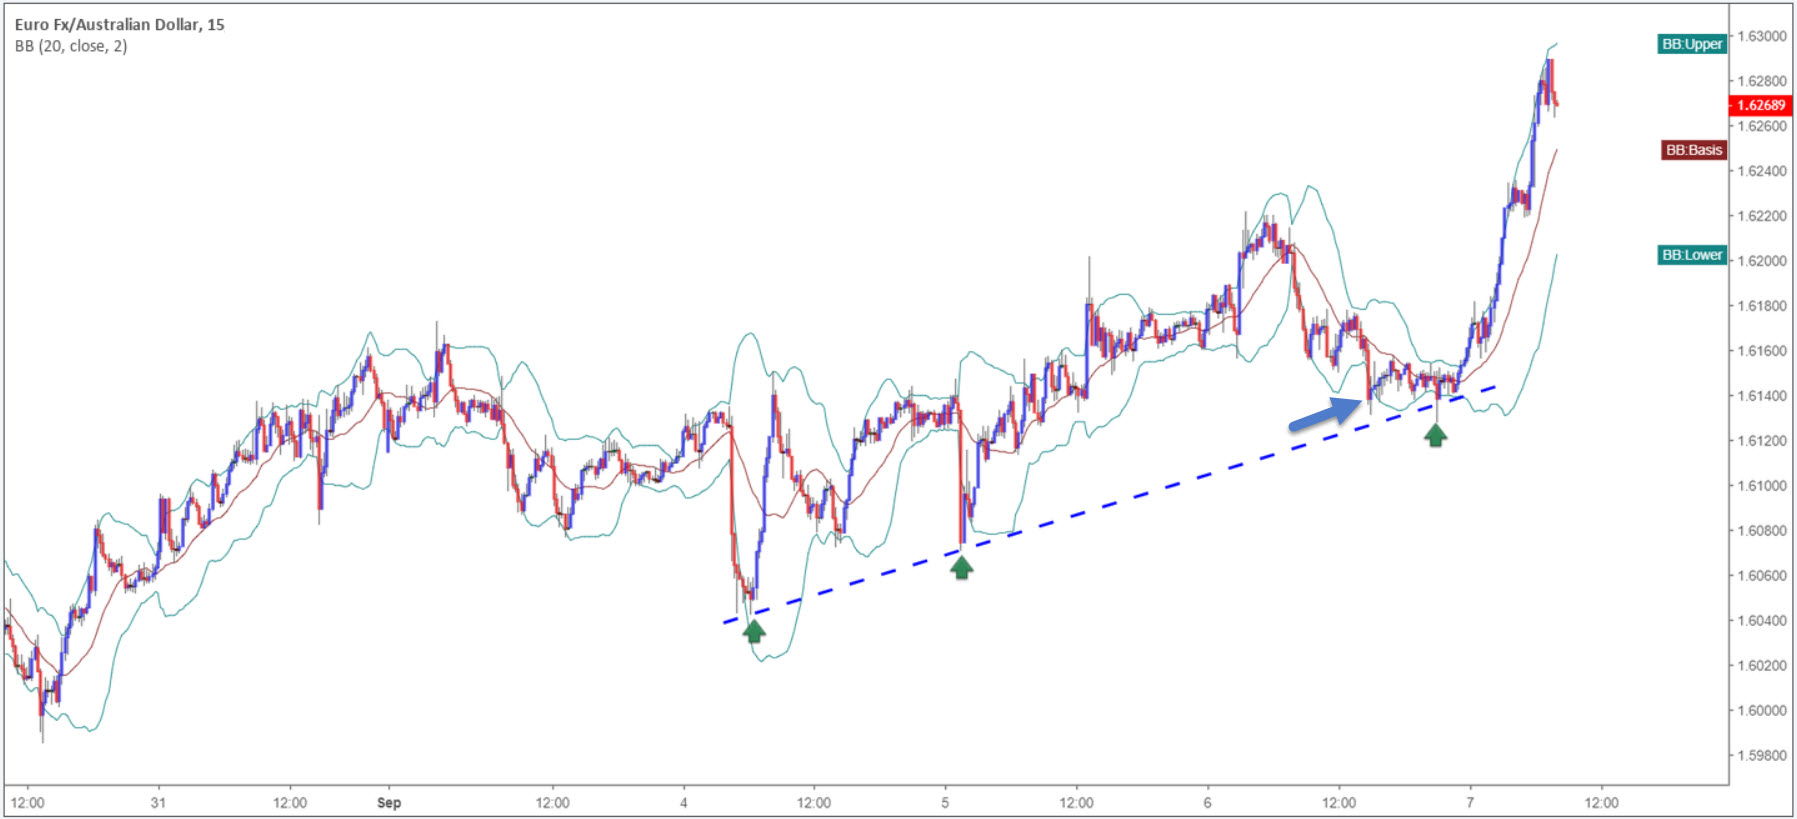
**Support and resistance** also plays a key part in determining the validity of a Bollinger Band signal. Looking at the same chart (posted below); there was a clear level of resistance-turned support in view. By selling the initial breakout (marked with a blue arrow on the chart above) it entailed shorting into not only the immediate trend, a clear trend line support but also a notable support level\!
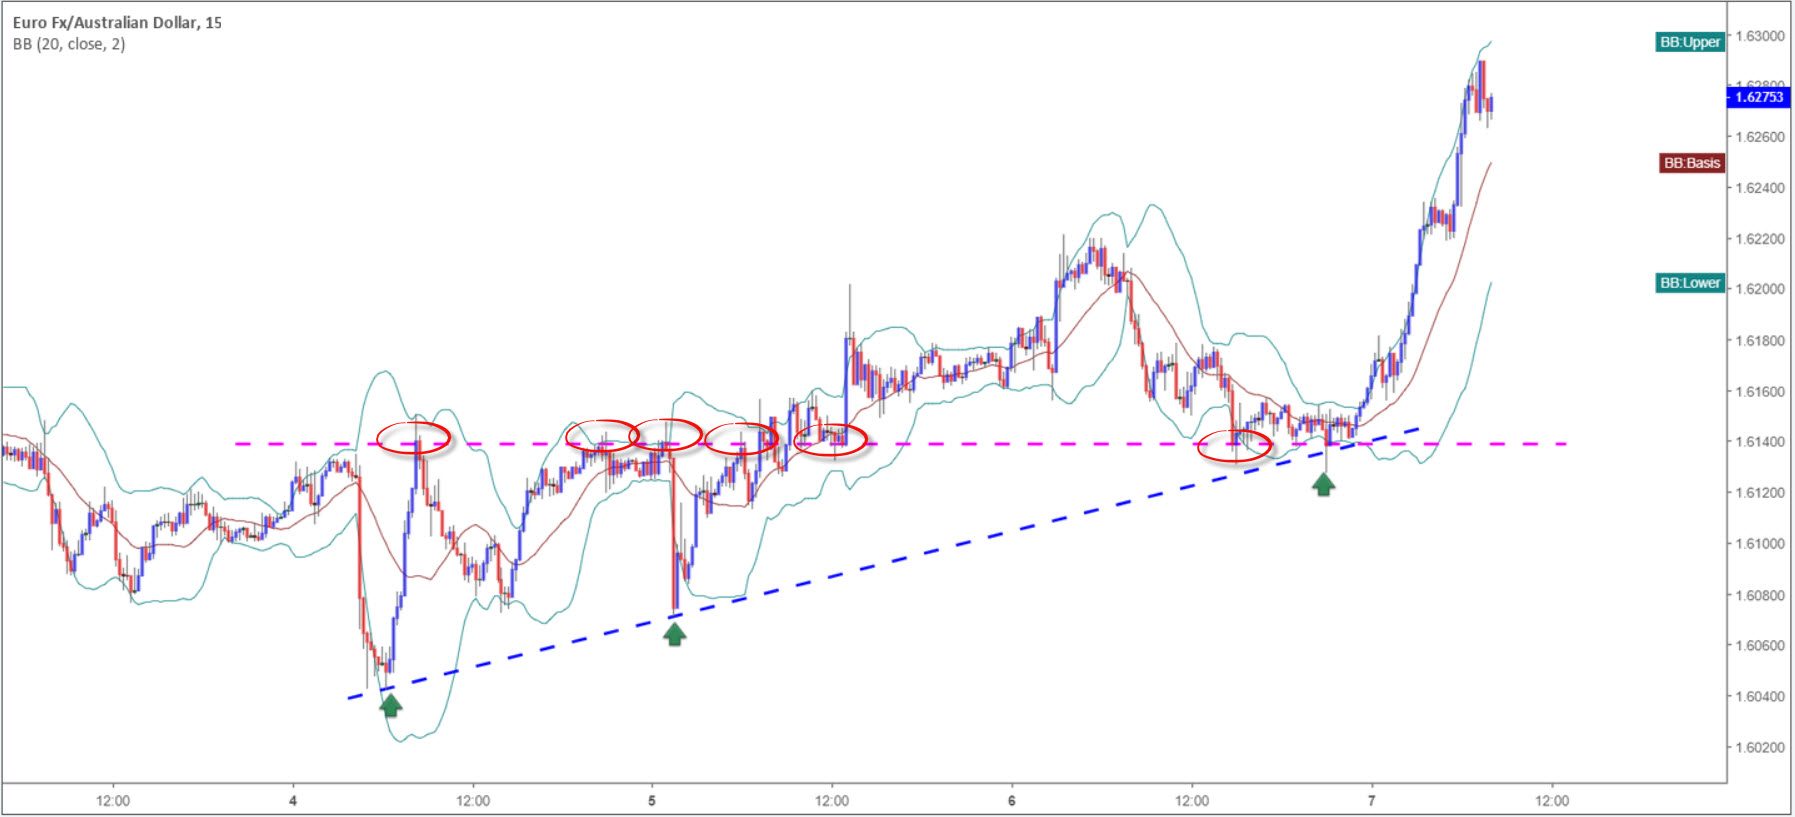
If a support level, a trend line support and trend direction is not enough to confirm a long bias from the lower Bollinger Band, maybe having a 61.8% Fibonacci support level fuse with the area may help:
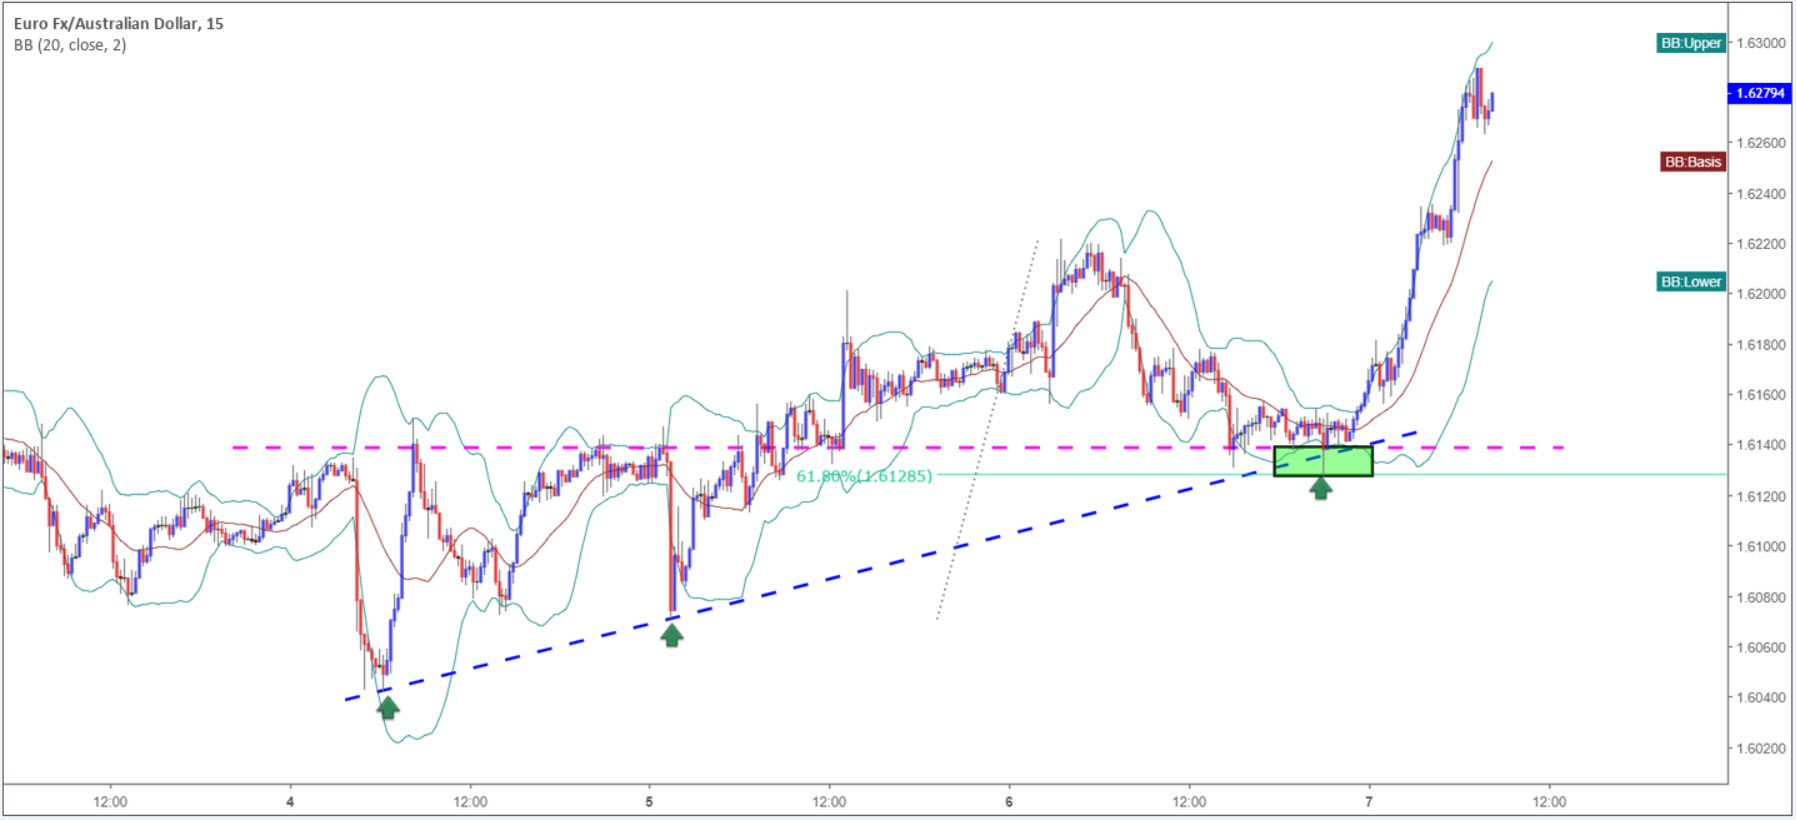
What you effectively did here was take the Bollinger bands as a foundation and shape a buy zone (marked in green) using multiple points of confluence. You also avoided a potential loss.
Of course, not all trades will deliver reversals quite as large as the one depicted above, though very often Bollinger bands supported with additional technical confirmation will produce a sizeable bounce.
## **Bottom line**
Considering most trading platforms offer in excess of 100 indicators, using technical analysis as a mode to trade is difficult for a lot of newer traders. Using the Bollinger Bands as a footing can simplify your trading strategy. Besides the indicator classifying overbought and oversold points in the market, it recognises market volatility and detects possible breakouts. This – coupled with additional technical tools like the ones underlined above – makes it a formidable methodology.
With that being the case, feel free to open a demo account here: <https://www.icmarkets.com/en/open-trading-account/demo> and road-test Bollinger Bands for yourself. You may just be surprised at how effective your trading becomes\!
##### Live Spreads
- Forex
- Indices
- Metals
### Recommended for You
6 years ago
#### [Forex Leverage and Margin Defined](https://www.icmarkets.com/blog/forex-leverage-and-margin-defined/)
by []()
6 years ago
#### [Forex Trading: What is the Spot Market?](https://www.icmarkets.com/blog/forex-trading-what-is-the-spot-market/)
by []()
6 years ago
#### [Forex Trading: An Introduction to Trading Strategies and Trading Styles](https://www.icmarkets.com/blog/forex-trading-an-introduction-to-trading-strategies-and-trading-styles/)
by []()
### Latest

Ex Dividends Indices
##### [Ex-Dividend 3/04/2026](https://www.icmarkets.com/blog/ex-dividend-3-04-2026/)
By IC

General Market Analysis
##### [General Market Analysis – 2/04/26](https://www.icmarkets.com/blog/general-market-analysis-2-04-26/)
By IC

Market Analysis
##### [Thursday 2nd April 2026: Asia-Pacific Shares Decline Amid Renewed U.S.–Iran Tensions](https://www.icmarkets.com/blog/thursday-2nd-april-2026-asia-pacific-shares-decline-amid-renewed-u-s-iran-tensions/)
By IC

Fundamental Analysis
##### [IC Markets Global – Asia Fundamental Forecast \| 02 April 2026](https://www.icmarkets.com/blog/ic-markets-global-asia-fundamental-forecast-02-april-2026/)
By IC
### Trade with a market leader you can rely on
[Open Trading Account](https://www.icmarkets.com/global/en/open-trading-account/live) [Try Demo Account](https://www.icmarkets.com/global/en/open-trading-account/demo)
IC mission is to create the best trading experience for retail and institutional clients alike, allowing traders to focus more on their trading. Built by traders for traders IC is dedicated to offering superior spreads, execution and service.
##### Trading
- [Accounts Overview](https://www.icmarkets.com/global/en/trading-accounts/overview)
- [Open an Account](https://www.icmarkets.com/global/en/open-trading-account/live)
- [Launch Web Trader](https://webtrader-sc.icmarkets.com/)
##### Trading Specifications
- [Spreads and Commissions](https://www.icmarkets.com/global/en/trading-pricing/spreads)
- [Range of Products](https://www.icmarkets.com/global/en/trading-markets/range-of-markets)
- [Trading Hours](https://www.icmarkets.com/global/en/trading-pricing/trading-hours)
- [Funding](https://www.icmarkets.com/global/en/trading-accounts/funding)
- [Withdrawal](https://www.icmarkets.com/global/en/trading-accounts/withdrawal)
##### About IC?
- [Help Centre](https://www.icmarkets.com/global/help-resources/help-centre)
- [Why IC](https://www.icmarkets.com/global/en/company/why-us)
- [Regulation](https://www.icmarkets.com/global/en/company/regulation)
- [Legal Documents](https://www.icmarkets.com/global/en/company/legal-documents)
- [Contact Us](https://www.icmarkets.com/global/en/company/contact-us)
IC is the trading name of Raw Trading Ltd, which is regulated by the Seychelles Financial Services Authority (FSA) with Securities Dealer’s license number SD018.
IC does not represent that the material provided here is accurate, current or complete, and therefore shouldn’t be relied upon as such. The information provided here, whether from a third party or not, is not to be considered as a recommendation; an offer to buy or sell; or the solicitation of an offer to buy or sell any security, financial product or instrument; or to participate in any particular trading strategy.
**Risk Warning**: Trading Forex and CFDs carries a high level of risk to your capital and you should only trade with money you can afford to lose. Trading Forex and CFDs may not be suitable for all investors, so please ensure that you fully understand the risks involved and seek independent advice if necessary. Please read and ensure you fully understand our [Risk Disclosure](https://cdn.icmarkets.com/uploads/FSA/Risk_Disclosure_Notice_FSA.pdf).
**Restricted Countries**: Raw Trading Ltd does not provide services for residents of certain countries such as the United States of America, Canada, Israel, New Zealand, Iran and North Korea (Democratic People’s Republic of Korea) or a country where such distribution or use would be contrary to local law or regulation.
You must be 18 years old, or of legal age as determined in your country. Upon registering an account with Raw Trading Ltd, you acknowledge that you are registering **at your own free will, without solicitation on behalf of Raw Trading Ltd**.
Raw Trading Ltd does not direct its website and services to any individual in any country in which the use of its website and services are prohibited by local laws or regulations. When accessing this website from a country in which its use may or may not be prohibited, it is the user’s **responsibility to ensure that any use of the website or services adheres to local laws or regulations**. Raw Trading Ltd does not affirm that the information on its website is suitable for all jurisdictions.
[Terms and Conditions](https://cdn.icmarkets.com/uploads/FSA/IC+Markets+Terms+%26+Condition+FSA.pdf)
[Privacy Policy](https://cdn.icmarkets.com/uploads/FSA/IC+Markets+Privacy+Policy+FSA.pdf)
[Cookies Policy](https://cdn.icmarkets.com/uploads/FSA/IC+Markets+Cookies+Policy+FSA.pdf)
[Legal Documents](https://www.icmarkets.com/global/en/company/legal-documents)
© 2025 Raw Trading Ltd \| All rights reserved. |
| Readable Markdown | The history of trading bands, envelopes and channels is long and interesting.
In the years since the creation of Bollinger Bands in 1983, a number of adaptive bands were created. Chief among them were Keltner Channels, introduced by Chester Keltner in the 1960s. This technical indicator is similar to Bollinger Bands, though rather than using the standard deviation, Keltner Channels use the Average True Range (ATR) to set channel distance.
Created by John A. Bollinger, Bollinger Bands have undoubtedly stood the test of time and proven to be one of the more robust indicators available in the technical community today.
A recognised trader, multiple books, TV appearances, investments, numerous board memberships with Technical Associations and a research firm, certainly places Bollinger at the top of the pile in the trading arena.
## **Bollinger Band construction**
The structure behind the trading bands is quite straightforward, visually depicted using three lines enveloping market data:
Bollinger Bands are envelopes plotted at a standard deviation level above and below a simple moving average (SMA), usually set to a period of 20 days (approximately the number of trading days in a month). Because the distance of the bands is based on standard deviation, they adjust to volatility swings in the underlying price.
The central line serves as a foundation to create its surrounding bands. Typically, the outer lines are positioned at two standard deviations.
According to Bollinger, approximately 90% of price action occurs between the two bands at 20 periods and two standard deviations.
Should traders feel the need to alter the calculation period and keep the containment percentage constant, however, increasing/decreasing the bandwidth is necessary.
Bandwidth measures the distance between the two bands using the following calculation: BW = (Upper BB – Lower BB) / Moving Average. Shortening the calculation period to 10 days, it is recommended to decrease the bandwidth from 2.0 to 1.9, whereas lengthening the calculation period to 50 days, increasing the bandwidth from 2.0 to 2.1 is suggested.
## **The many uses Bollinger Bands offer**
**Identify overbought/oversold markets:**
When price action approaches the upper Bollinger Band, the indicator considers this a statistically ‘expensive’ market, or more commonly referred to in the technical world as ‘overbought’. The same can be said for a market testing the lower band, only this position defines a ‘cheap’ market, or ‘oversold’. The logic here comes from the upper and lower bands being positioned two standard deviations from the market average (the mean), which in the case of Bollinger Bands, as emphasised above, is a 20-day simple moving average.
Although relatively straightforward, trading overbought/oversold points in isolation is challenging. Check out the EUR/AUD currency pair (M15 timeframe) posted below, you clearly see instances the upper and lower bands highlighted potential areas to trade (orange and blue arrows), though there are also times (black zones) the candlesticks hugged the upper and lower bands.
While the bands do underline overbought/oversold points, it does not always translate to a trading opportunity. The reason being is trending markets, or extended moves, forces price action to skirt the upper and lower bands.

**Recognise** **market volatility:**
Bollinger Bands provide traders a clear visual of market volatility.
Sometimes referred to as ‘the squeeze’, Bollinger Bands expand on high volatility and contract, or squeeze, on low volatility. Unless you’re a scalper looking to pick off small moves, avoiding environments exhibiting low volatility is likely best, given the limited profit potential.
Below is a typical Bollinger squeeze:

**Detect potential breakouts:**
Due to the fact volatility generally expands following a period of contraction, identifying possible breakouts using Bollinger Bands is a popular strategy. Traders can visually recognize when an instrument is consolidating on low volatility as the upper and lower bands squeeze – the Bollinger squeeze as briefly featured above.
Not only useful for breakout traders, trend traders also find this technique particularly valuable to ascertain trend strength, offering opportunities to potentially jump aboard a trend or pyramid a current position.
The longer price action remains within its consolidation, the stronger the breakout tends to be.
Methods of confirming a breakout using Bollinger Bands come in many forms. The most obvious is a candle close beyond the outer limits. Some prefer to observe two candle closes, though this would get you in at a worse price and reduce risk/reward.
## Not a standalone indicator
Although Bollinger Bands are a favourite among technical analysts, using it alongside additional tools as a basis for a complete trading strategy is highly likely going to improve your bottom line.
As is the case with most technical indicators, making informed trading decisions based on one indicator is a challenge. Some would say impossible. Bollinger considers convergences between Bollinger Bands and technical tools (technical analysis) to be a successful approach.
**Implementing trend analysis**, alongside the Bollinger Bands, has, for some traders, proven a fruitful method. If a market is trending north for an extended period of time, initiating short positions is a chancy play; even if price is touching the upper Bollinger band (overbought) or has broken the lower Bollinger Band (indicating a breakout to the downside may occur).
Below is a good example of a trending currency pair converging with a trend line support at the lower Bollinger Band during a time the indicator was emphasizing low market volatility. Also note, there was a candlestick close to the downside through the lower edge of the Bollinger Band marked with a blue arrow. Entering short on this candle close as a breakout setup, in this situation, meant selling within a trending market that was approaching a trend line support. As you can see, in conditions like this, trend analysis saved an unnecessary loss.

**Support and resistance** also plays a key part in determining the validity of a Bollinger Band signal. Looking at the same chart (posted below); there was a clear level of resistance-turned support in view. By selling the initial breakout (marked with a blue arrow on the chart above) it entailed shorting into not only the immediate trend, a clear trend line support but also a notable support level\!

If a support level, a trend line support and trend direction is not enough to confirm a long bias from the lower Bollinger Band, maybe having a 61.8% Fibonacci support level fuse with the area may help:

What you effectively did here was take the Bollinger bands as a foundation and shape a buy zone (marked in green) using multiple points of confluence. You also avoided a potential loss.
Of course, not all trades will deliver reversals quite as large as the one depicted above, though very often Bollinger bands supported with additional technical confirmation will produce a sizeable bounce.
## **Bottom line**
Considering most trading platforms offer in excess of 100 indicators, using technical analysis as a mode to trade is difficult for a lot of newer traders. Using the Bollinger Bands as a footing can simplify your trading strategy. Besides the indicator classifying overbought and oversold points in the market, it recognises market volatility and detects possible breakouts. This – coupled with additional technical tools like the ones underlined above – makes it a formidable methodology.
With that being the case, feel free to open a demo account here: <https://www.icmarkets.com/en/open-trading-account/demo> and road-test Bollinger Bands for yourself. You may just be surprised at how effective your trading becomes\! |
| Shard | 71 (laksa) |
| Root Hash | 15535101667771986871 |
| Unparsed URL | com,icmarkets!www,/blog/bollinger-bands/ s443 |