ℹ️ Skipped - page is already crawled
| Filter | Status | Condition | Details |
|---|---|---|---|
| HTTP status | PASS | download_http_code = 200 | HTTP 200 |
| Age cutoff | PASS | download_stamp > now() - 6 MONTH | 0.4 months ago |
| History drop | PASS | isNull(history_drop_reason) | No drop reason |
| Spam/ban | PASS | fh_dont_index != 1 AND ml_spam_score = 0 | ml_spam_score=0 |
| Canonical | PASS | meta_canonical IS NULL OR = '' OR = src_unparsed | Not set |
| Property | Value | |||||||||
|---|---|---|---|---|---|---|---|---|---|---|
| URL | https://www.fool.com/investing/how-to-calculate/annualized-volatility/ | |||||||||
| Last Crawled | 2026-04-12 09:36:37 (11 days ago) | |||||||||
| First Indexed | 2024-03-12 01:35:28 (2 years ago) | |||||||||
| HTTP Status Code | 200 | |||||||||
| Content | ||||||||||
| Meta Title | How to Calculate Annualized Volatility | The Motley Fool | |||||||||
| Meta Description | Unlock insights into stock volatility. Learn to calculate and annualize using historical data for informed investment strategies. | |||||||||
| Meta Canonical | null | |||||||||
| Boilerpipe Text | Annualized volatility measures how much a stock price varies over one year. Many investors use volatility to define the riskiness of a stock, bond, or asset class. In addition, assumptions about volatility are used to price
options
.
Image source: Getty Images.
No investor invests without comparing risk to reward, so annualized volatility is integral to any investor's toolbox. We'll outline how to calculate volatility and provide an example to serve as a reference point for readers interested in the concept.
What is volatility?
The most common way to
measure volatility in finance
is through standard deviation. This is a mathematical expression of how much a variable can differ from its average.
To help investors grasp the concept of volatility, consider investing in two funds. Fund A has returned 10% each year over the last three years. Fund B has returned 8%, 12%, and 10%.
Both funds have an average
yearly return
of 10%, but Fund B is more volatile because its returns vary more. Using a simple Excel worksheet and the standard deviation function (stdev), you can see that Fund A's standard deviation is zero (meaning its returns don't vary around the mean). In contrast, the standard deviation for Fund B is 2%.
Assuming a normal distribution -- a bell-shaped curve that assumes 68% of variables are within one standard deviation from the mean and 95% of variables are within two standard deviations -- you could argue the following for Fund B:
68% of the time, the fund will generate a return between 8% and 12%.
95% of the time, the fund will generate a return between 6% and 14%.
The above example is simplified to illustrate a point. However, in the real world, investors won't always have the time or patience to wait years to calculate potential returns and volatility.
That's where the idea of annualized volatility comes in. By annualizing short-term data, investors can know
how volatile a stock will be
over the course of a year just by using the data. In this case, I will illustrate the concept by examining the monthly returns on two U.S.-listed stocks.
Annualized volatility formula
But first, here's a look at the formula for
calculating annualized volatility
.
Annualized volatility = standard deviation (volatility) multiplied by the square root of the periods in the year.
For example, you might calculate the volatility of daily stock returns. Since there are roughly 252 trading days in the year, you multiply the square root of 252 (15.9) by the daily volatility to get the annualized volatility. (We'll use monthly returns in the case below, so the time period will be 12 times a year.)
Calculating a stock's volatility
The chart below shows the monthly returns for two stocks. Just from the chart's appearance, Stock A is more volatile than Stock B, but this needs to be expressed mathematically.
Data source: author's analysis.
The first step is to calculate the monthly volatility of each stock's return. You can easily do this using an Excel spreadsheet and calculating the standard deviation (stdev function) of the 12 monthly returns for each
stock
, as shown in the chart above.
Doing this gives a monthly standard deviation (volatility) of 17.9% for Stock A and just 3.6% for Stock B. This confirms the optics in the chart. In other words, Stock A is a more volatile -- and, some might say, riskier -- investment than Stock B.
Annualizing volatility
Returning to the formula for annualized volatility, the figures above are monthly returns. There are 12 months in the year, so the annualized volatility is calculated by multiplying the square root of 12 by the monthly volatility. Here's how we calculate annualized volatility for the two stocks:
Stock A annualized volatility = 17.9% multiplied by the square root of 12, resulting in 62%
Stock B annualized volatility = 3.6% multiplied by the square root of 12, resulting in 12.5%
We can see that Stock A is notably more volatile than Stock B, which might be a factor to consider when
investing in stocks
.
The bottom line on calculating annualized volatility
It's important to remember that annualized volatility is just one of many tools investors must consider. The history of investing is full of
investment strategies
that demonstrated low volatility and good returns -- right before they blew up in an investor's face.
In addition, the data is always historical, and there's no guarantee that stock returns will follow historical patterns. The assumption that volatility or standard deviation is equivalent to risk is also an open question.
Related investing topics
For example, going back to the first example above, Fund B is
seen
as riskier because its returns are more volatile than Fund A. However, the implied annual return is precisely the same at 10% for both funds. All told, volatility and annualized volatility are simply useful concepts that can serve as a starting point for thinking about
risk and reward
in investing.
FAQ
About the Author
Lee Samaha is a contributing Stock Market Analyst at The Motley Fool covering industrials, electricals, energy, materials, transportation, and infrastructure stocks.
Prior to The Motley Fool, Lee was a Civil Engineer and Investment Manager.
He holds a Bachelor of Civil and Structural Engineering from Southampton University and a Certificate in Investment Management from Chartered Institute for Securities & Investment.
Lee first cut his investing teeth on The Motley Fool bulletin boards (commonly referred to as the “Fool Boards,”) and he’s infinitely grateful to all of the investors he learned from in this powerful investing community.
The Motley Fool has a
disclosure policy
. | |||||||||
| Markdown | [Accessibility Menu](https://www.fool.com/investing/how-to-calculate/annualized-volatility/)
Search for a company
[Accessibility](https://www.fool.com/investing/how-to-calculate/annualized-volatility/)
Log In
[Help](https://support.fool.com/)
[](https://www.fool.com/)
- Our Services
[All Services](https://www.fool.com/services/)[Stock Advisor](https://www.fool.com/services/stock-advisor/)[Epic](https://www.fool.com/services/epic/)[Epic Plus](https://www.fool.com/services/epic-plus/)[Fool Portfolios](https://www.fool.com/services/fool-portfolios/)[Fool One](https://www.fool.com/services/one/)[All Podcasts](https://www.fool.com/podcasts/)[Motley Fool Money Podcast](https://www.fool.com/podcasts/motley-fool-money/)[Rule Breaker Investing Podcast](https://www.fool.com/podcasts/rule-breaker-investing/)[The Motley Fool Foundation](https://foolfoundation.org/)
- Stock Market News
[Live Coverage](https://www.fool.com/investing/live-coverage/)[Trending News](https://www.fool.com/trending-news/)[Stock Market News](https://www.fool.com/investing-news/)[Market Movers](https://www.fool.com/market-movers/)[Tech Stock News](https://www.fool.com/tech-stock-news/)[Market Trends](https://www.fool.com/market-trends/)[Crypto News](https://www.fool.com/crypto-news/)[Stock Market Indexes Today](https://www.fool.com/markets/)[Most Active Stocks Today](https://www.fool.com/markets/most-active-stocks/)[Today's Biggest Stock Gainers](https://www.fool.com/markets/top-stock-gainers/)[Today's Biggest Stock Losers](https://www.fool.com/markets/top-stock-losers/)[Stock Quotes by Exchange](https://www.fool.com/quote/)[Market Research](https://www.fool.com/research/)[📨 Breakfast News](https://www.fool.com/investing/breakfast-news/)[Top Stocks to Buy Now](https://www.fool.com/investing/top-stocks-to-buy-and-hold/)[Best ETFs to Buy](https://www.fool.com/investing/how-to-invest/etfs/etfs-to-buy/)[Best AI Stocks](https://www.fool.com/investing/stock-market/market-sectors/information-technology/ai-stocks/)[Best Growth Stocks](https://www.fool.com/investing/stock-market/types-of-stocks/growth-stocks/)[Dividend Kings](https://www.fool.com/investing/stock-market/types-of-stocks/dividend-stocks/dividend-kings/)[Best Index Funds](https://www.fool.com/investing/how-to-invest/index-funds/best-index-funds/)[Next Cryptos to Explode](https://www.fool.com/investing/stock-market/market-sectors/financials/cryptocurrency-stocks/next-crypto-to-explode/)[Technology](https://www.fool.com/investing/stock-market/market-sectors/information-technology/)[Energy](https://www.fool.com/investing/stock-market/market-sectors/energy/)[Real Estate](https://www.fool.com/investing/stock-market/market-sectors/real-estate-investing/)[Healthcare](https://www.fool.com/investing/stock-market/market-sectors/healthcare/)[Consumer Goods](https://www.fool.com/investing/stock-market/market-sectors/consumer-staples/)[Materials](https://www.fool.com/investing/stock-market/market-sectors/materials/)[Industrials](https://www.fool.com/investing/stock-market/market-sectors/industrials/)
- How to Invest
[How to Invest Money](https://www.fool.com/investing/how-to-invest/)[What to Invest In](https://www.fool.com/investing/how-to-invest/what-to-invest-in/)[How to Invest in Stocks](https://www.fool.com/investing/how-to-invest/stocks/)[How to Invest in ETFs](https://www.fool.com/investing/how-to-invest/etfs/)[How to Invest in Index Funds](https://www.fool.com/investing/how-to-invest/index-funds/)[How to Invest in Bonds](https://www.fool.com/investing/how-to-invest/bonds/)[Financial Dictionary](https://www.fool.com/terms/)[Stock Market 101](https://www.fool.com/investing/stock-market/)[Types of Stocks](https://www.fool.com/investing/stock-market/types-of-stocks/)[Stock Market Sectors](https://www.fool.com/investing/stock-market/market-sectors/)[Stock Market Indexes](https://www.fool.com/investing/stock-market/indexes/)[What Are Stock Splits?](https://www.fool.com/terms/s/stock-split/)[What Is Compound Interest?](https://www.fool.com/investing/how-to-invest/stocks/compound-interest-accounts/)[After Hours Trading](https://www.fool.com/terms/a/after-hours-trading/)[How to Buy Stock](https://www.fool.com/investing/how-to-invest/stocks/how-to-buy-stock/)[Best Brokers for Beginners](https://www.fool.com/money/buying-stocks/best-online-stock-brokers-for-beginners/)[Best Brokerage Accounts](https://www.fool.com/money/buying-stocks/)[Good Time to Buy Stocks](https://www.fool.com/investing/how-to-invest/stocks/good-time-to-buy-stocks/)[How Many Shares to Buy?](https://www.fool.com/investing/how-to-invest/stocks/how-many-shares-buy-stock/)[Portfolio Diversification](https://www.fool.com/investing/how-to-invest/portfolio-diversification/)[How to Invest \$100](https://www.fool.com/investing/how-to-invest/how-to-invest-100-dollars/)[Magnificent Seven Companies](https://www.fool.com/investing/how-to-invest/stocks/magnificent-seven/)[Warren Buffett Investments](https://www.fool.com/investing/how-to-invest/famous-investors/warren-buffett-investments/)[Investing in ChatGPT](https://www.fool.com/investing/stock-market/market-sectors/information-technology/ai-stocks/chatgpt/)[Investing in SpaceX](https://www.fool.com/investing/how-to-invest/stocks/how-to-invest-in-spacex-stock/)[Investing in OpenAI](https://www.fool.com/investing/how-to-invest/stocks/how-to-invest-in-openai-stock/)[Investing in Nvidia](https://www.fool.com/investing/how-to-invest/stocks/how-to-invest-in-nvidia-stock/)[Investing in Databricks](https://www.fool.com/investing/how-to-invest/stocks/how-to-invest-in-databricks/)
- Retirement
[Retirement News](https://www.fool.com/retirement-news/)[Retirement 101](https://www.fool.com/retirement/)[Types of Retirement Accounts](https://www.fool.com/retirement/plans/)[How to Contribute to 401k/IRA?](https://www.fool.com/retirement/plans/401k/contribute-to-401k-and-ira/)[Strategies to Save for Retirement](https://www.fool.com/retirement/strategies/)[Asset Allocation for My Age](https://www.fool.com/retirement/strategies/asset-allocation-by-age/)[Best IRA Brokerage Accounts](https://www.fool.com/money/buying-stocks/best-ira-accounts/)[Social Security 101](https://www.fool.com/retirement/social-security/)[How to Maximize Social Security?](https://www.fool.com/retirement/social-security/how-to-maximize-social-security/)[Full Retirement Age](https://www.fool.com/retirement/social-security/full-retirement-age/)[COLAs](https://www.fool.com/retirement/social-security/colas/)[Calculate Your SS Benefits](https://www.fool.com/retirement/social-security/benefits-formula/)[Collecting Spousal Benefits](https://www.fool.com/retirement/social-security/spousal-benefits/)[Maximize Social Security Benefit](https://www.fool.com/retirement/social-security/how-to-maximize-social-security/)[How Much Do I Need to Retire?](https://www.fool.com/retirement/how-much-do-i-need/)[When To Retire](https://www.fool.com/retirement/strategies/when-can-i-retire/)[401(k) Plans](https://www.fool.com/retirement/plans/401k/)[403(b) Plans](https://www.fool.com/retirement/plans/403b/)[Roth IRA Plans](https://www.fool.com/retirement/plans/roth-ira/)[IRA Plans](https://www.fool.com/retirement/plans/ira/)[HSA Plans](https://www.fool.com/retirement/plans/hsa/)[Complete Retirement Guide](https://www.fool.com/retirement/complete-guide/)[Best & Worst States to Retire](https://www.fool.com/research/best-states-to-retire/)[Average Retirement Savings](https://www.fool.com/research/average-retirement-savings/)[Moving for Retirement](https://www.fool.com/retirement/relocation/)[Healthcare in Retirement](https://www.fool.com/retirement/healthcare-in-retirement/)[Understanding Taxes in Retirement](https://www.fool.com/retirement/taxes/)[401(k) Minimum Distributions](https://www.fool.com/retirement/plans/401k/required-minimum-distributions/)
- Personal Finance
[Best Credit Cards](https://www.fool.com/money/credit-cards/best-credit-cards/)[Compare Credit Cards](https://www.fool.com/money/credit-cards/compare-cards/)[Credit Card Reviews](https://www.fool.com/money/credit-cards/reviews/)[Credit Card Guides and Tools](https://www.fool.com/money/credit-cards/guides-tools/)[Best Savings Accounts](https://www.fool.com/money/banks/savings-accounts/best-savings-accounts/)[Bank Reviews](https://www.fool.com/money/banks/reviews/)[Best Personal Loans](https://www.fool.com/money/personal-loans/)[Personal Loan Reviews](https://www.fool.com/money/personal-loans/reviews/)[Best Mortgage Lenders](https://www.fool.com/money/mortgages/best-mortgage-lenders/)[Current Mortgage Rates](https://www.fool.com/money/mortgages/rates/)[Mortgage Lender Reviews](https://www.fool.com/money/mortgages/reviews/)[Guide to Mortgages](https://www.fool.com/money/mortgages/)[Auto Insurance](https://www.fool.com/money/insurance/auto/)[Home Insurance](https://www.fool.com/money/insurance/homeowners/)[Life Insurance](https://www.fool.com/money/insurance/life/)
- About Us
[About Us](https://www.fool.com/about/)[Contact Us](https://www.fool.com/contact/customer-service/)[Investing Philosophy](https://www.fool.com/about/investing-philosophy/)[Motley Fool Money](https://www.fool.com/money/)[The Motley Fool Foundation](https://foolfoundation.org/)[Reviews](https://www.fool.com/about/reviews/)[Newsroom](https://www.fool.com/contact/newsroom/)[YouTube](https://www.youtube.com/channel/UCpRQuynBX9Qy9tPrcswpPag)[LinkedIn](https://www.linkedin.com/company/the-motley-fool/)[X](https://x.com/themotleyfool)[Facebook](https://www.facebook.com/themotleyfool/)[Instagram](https://www.instagram.com/themotleyfoolofficial/)[Discussion Boards](https://discussion.fool.com/)[CAPS - Stock Picking Community](https://caps.fool.com/)[Advertise With Us](https://www.fool.com/advertising/)[Become an Affiliate Partner](https://www.fool.com/affiliates/)[Publishing Standards](https://www.fool.com/about/the-motley-fools-publishing-standards/)[All Services](https://www.fool.com/services/)[Stock Advisor](https://www.fool.com/services/stock-advisor/)[Epic](https://www.fool.com/services/epic/)[Epic Plus](https://www.fool.com/services/epic-plus/)[Fool Portfolios](https://www.fool.com/services/fool-portfolios/)[Fool One](https://www.fool.com/services/one/)
- [Top 10 Stocks to Buy Now ›](https://api.fool.com/infotron/splitter/route/article-template-button?apikey=5c8e52dd-1bea-455e-87f5-d5506e590f21)
[Top 10 Stocks to Buy Now ›](https://api.fool.com/infotron/splitter/route/article-template-button?apikey=5c8e52dd-1bea-455e-87f5-d5506e590f21)
[S\&P 500 6,816.89-0.1% -7.77](https://www.fool.com/quote/snpindex/^gspc/)
[DJI 47,916.57-0.6% -269.23](https://www.fool.com/quote/djindices/^dji/)
[NASDAQ 22,902.89+0.4% +80.48](https://www.fool.com/quote/nasdaqindex/^ixic/)
[Bitcoin \$71,618.00-1.7% -\$1,274.68](https://www.fool.com/quote/crypto/btc/)
[AMZN \$238.43+2.0% +\$4.78](https://www.fool.com/quote/nasdaq/amzn/)
[GOOG \$315.72-0.2% -\$0.65](https://www.fool.com/quote/nasdaq/goog/)
[META \$629.75+0.2% +\$1.36](https://www.fool.com/quote/nasdaq/meta/)
[MSFT \$370.82-0.6% -\$2.25](https://www.fool.com/quote/nasdaq/msft/)
[NVDA \$188.67+2.6% +\$4.76](https://www.fool.com/quote/nasdaq/nvda/)
[TSLA \$348.95+1.0% +\$3.33](https://www.fool.com/quote/nasdaq/tsla/)
[Most Active Stocks](https://www.fool.com/markets/most-active-stocks/)[Daily Stock Gainers](https://www.fool.com/markets/top-stock-gainers/)[Daily Stock Losers](https://www.fool.com/markets/top-stock-losers/)
[Most Active Stocks](https://www.fool.com/markets/most-active-stocks/)[Daily Stock Gainers](https://www.fool.com/markets/top-stock-gainers/)[Daily Stock Losers](https://www.fool.com/markets/top-stock-losers/)
1. [Home](https://www.fool.com/)\>
2. [Investing](https://www.fool.com/investing-news/)\>
3. [How To Calculate](https://www.fool.com/investing/how-to-calculate/)\>
4. Annualized Volatility
# How to Calculate Annualized Volatility
By [Lee Samaha](https://www.fool.com/author/2492/) – Updated Apr 30, 2025 at 10:20 PM EST
[Follow us](https://profile.google.com/cp/CgkvbS8wNTc4bWs)
Share
## Key Points
- Annualized volatility is calculated as standard deviation times square root of periods.
- High annualized volatility indicates greater price variability and potential risk.
- Investors use annualized volatility to compare risk and make informed choices.
- [What is volatility?](https://www.fool.com/investing/how-to-calculate/annualized-volatility/#toc_what-is-volatility)
- [Annualized volatility formula](https://www.fool.com/investing/how-to-calculate/annualized-volatility/#toc_annualized-volatility-formula)
- [Calculating volatility](https://www.fool.com/investing/how-to-calculate/annualized-volatility/#toc_calculating-volatility)
- [Annualizing volatility](https://www.fool.com/investing/how-to-calculate/annualized-volatility/#toc_annualizing-volatility)
- [FAQ](https://www.fool.com/investing/how-to-calculate/annualized-volatility/#toc_faq)
Annualized volatility measures how much a stock price varies over one year. Many investors use volatility to define the riskiness of a stock, bond, or asset class. In addition, assumptions about volatility are used to price [options](https://www.fool.com/terms/o/options/).
Image source: Getty Images.
No investor invests without comparing risk to reward, so annualized volatility is integral to any investor's toolbox. We'll outline how to calculate volatility and provide an example to serve as a reference point for readers interested in the concept.
## What is volatility?
The most common way to [measure volatility in finance](https://www.fool.com/terms/s/stock-market-volatility/) is through standard deviation. This is a mathematical expression of how much a variable can differ from its average.
To help investors grasp the concept of volatility, consider investing in two funds. Fund A has returned 10% each year over the last three years. Fund B has returned 8%, 12%, and 10%.
Both funds have an average [yearly return](https://www.fool.com/investing/how-to-invest/stocks/how-to-convert-daily-returns-to-annual-returns/) of 10%, but Fund B is more volatile because its returns vary more. Using a simple Excel worksheet and the standard deviation function (stdev), you can see that Fund A's standard deviation is zero (meaning its returns don't vary around the mean). In contrast, the standard deviation for Fund B is 2%.
Assuming a normal distribution -- a bell-shaped curve that assumes 68% of variables are within one standard deviation from the mean and 95% of variables are within two standard deviations -- you could argue the following for Fund B:
- 68% of the time, the fund will generate a return between 8% and 12%.
- 95% of the time, the fund will generate a return between 6% and 14%.
The above example is simplified to illustrate a point. However, in the real world, investors won't always have the time or patience to wait years to calculate potential returns and volatility.
That's where the idea of annualized volatility comes in. By annualizing short-term data, investors can know [how volatile a stock will be](https://www.fool.com/investing/stock-market/types-of-stocks/volatile-stocks/) over the course of a year just by using the data. In this case, I will illustrate the concept by examining the monthly returns on two U.S.-listed stocks.
## Annualized volatility formula
But first, here's a look at the formula for [calculating annualized volatility](https://www.fool.com/investing/how-to-invest/stocks/how-to-calculate-stock-volatility/).
- Annualized volatility = standard deviation (volatility) multiplied by the square root of the periods in the year.
For example, you might calculate the volatility of daily stock returns. Since there are roughly 252 trading days in the year, you multiply the square root of 252 (15.9) by the daily volatility to get the annualized volatility. (We'll use monthly returns in the case below, so the time period will be 12 times a year.)
## Calculating a stock's volatility
The chart below shows the monthly returns for two stocks. Just from the chart's appearance, Stock A is more volatile than Stock B, but this needs to be expressed mathematically.
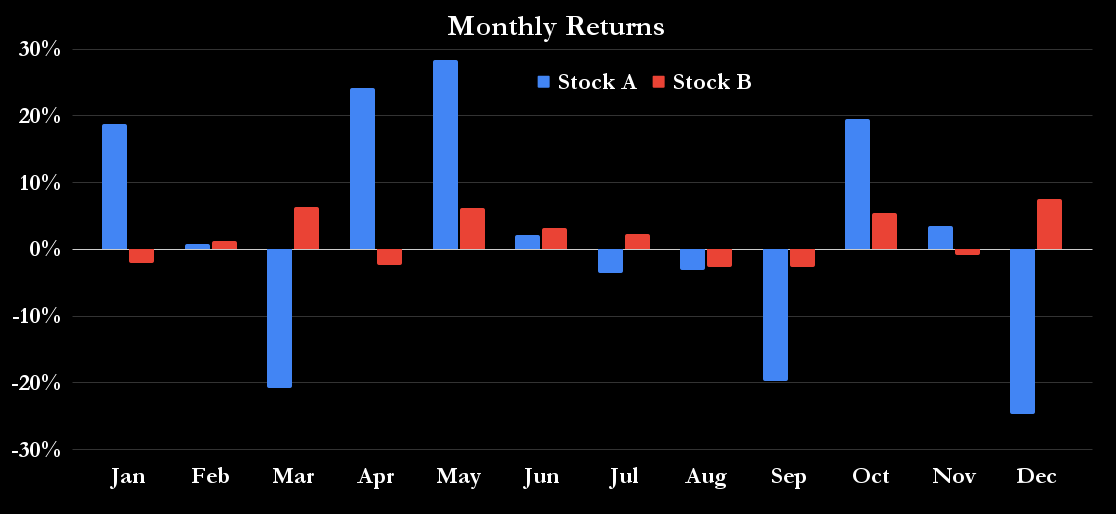
Data source: author's analysis.
The first step is to calculate the monthly volatility of each stock's return. You can easily do this using an Excel spreadsheet and calculating the standard deviation (stdev function) of the 12 monthly returns for each [stock](), as shown in the chart above.
Doing this gives a monthly standard deviation (volatility) of 17.9% for Stock A and just 3.6% for Stock B. This confirms the optics in the chart. In other words, Stock A is a more volatile -- and, some might say, riskier -- investment than Stock B.
## Annualizing volatility
Returning to the formula for annualized volatility, the figures above are monthly returns. There are 12 months in the year, so the annualized volatility is calculated by multiplying the square root of 12 by the monthly volatility. Here's how we calculate annualized volatility for the two stocks:
- Stock A annualized volatility = 17.9% multiplied by the square root of 12, resulting in 62%
- Stock B annualized volatility = 3.6% multiplied by the square root of 12, resulting in 12.5%
We can see that Stock A is notably more volatile than Stock B, which might be a factor to consider when [investing in stocks](https://www.fool.com/investing/how-to-invest/stocks/).
## The bottom line on calculating annualized volatility
It's important to remember that annualized volatility is just one of many tools investors must consider. The history of investing is full of [investment strategies]() that demonstrated low volatility and good returns -- right before they blew up in an investor's face.
In addition, the data is always historical, and there's no guarantee that stock returns will follow historical patterns. The assumption that volatility or standard deviation is equivalent to risk is also an open question.
## Related investing topics
[How to Calculate the Net Worth on Financial StatementsThe net worth of a business is also known as its book value or its owners' (stockholders') equity.](https://www.fool.com/investing/how-to-calculate/net-worth-on-financial-statements/)
[How to Calculate the Present Value of Free Cash FlowHere's an explanation and simple example of how to calculate the present value of free cash flow.](https://www.fool.com/investing/how-to-calculate/present-value-of-free-cash-flow/)
[How to Calculate the Percentage of Annual DeclineHere's what you need to know to calculate annual decline over any time period.](https://www.fool.com/investing/how-to-calculate/percentage-of-annual-decline/)
[Here's How to Calculate Future Expected Stock PriceCalculating the future expected stock price can be useful, but no single equation can be used universally.](https://www.fool.com/investing/how-to-invest/stocks/how-to-calculate-future-stock-price/)
For example, going back to the first example above, Fund B is *seen* as riskier because its returns are more volatile than Fund A. However, the implied annual return is precisely the same at 10% for both funds. All told, volatility and annualized volatility are simply useful concepts that can serve as a starting point for thinking about [risk and reward](https://www.fool.com/research/gen-z-millennial-investors-risk/) in investing.
## FAQ
## How to calculate annualized volatility: FAQ
### What is the formula for annualized volatility?
### How is volatility calculated?
### What is annualized volatility used for?
### About the Author

Lee Samaha is a contributing Stock Market Analyst at The Motley Fool covering industrials, electricals, energy, materials, transportation, and infrastructure stocks. Prior to The Motley Fool, Lee was a Civil Engineer and Investment Manager. He holds a Bachelor of Civil and Structural Engineering from Southampton University and a Certificate in Investment Management from Chartered Institute for Securities & Investment. Lee first cut his investing teeth on The Motley Fool bulletin boards (commonly referred to as the “Fool Boards,”) and he’s infinitely grateful to all of the investors he learned from in this powerful investing community.
[TMFSaintGermain](https://www.fool.com/author/2492/)
[@LeeSamaha](https://x.com/LeeSamaha)
The Motley Fool has a [disclosure policy](https://www.fool.com/legal/fool-disclosure-policy/).
## Read Next
[How to Calculate Net Change in Cash From a Cash Flow Statement](https://www.fool.com/investing/how-to-calculate/net-change-in-cash/)
[How to Calculate Accrued Interest](https://www.fool.com/investing/how-to-calculate/accrued-interest/)
[How to Calculate Semi-Annual Bond Yield](https://www.fool.com/investing/how-to-calculate/semi-annual-bond-yield/)
[How to Calculate a Monthly Return on Investment](https://www.fool.com/investing/how-to-calculate/monthly-return-on-investment/)
[How to Calculate the Number of Shares a Company Has](https://www.fool.com/investing/how-to-calculate/shares-a-company-has/)
[How to Calculate the Price of a Treasury Bill](https://www.fool.com/investing/how-to-calculate/price-of-treasury-bills/)
## Premium Investing Services
Invest better with The Motley Fool. Get stock recommendations, portfolio guidance, and more from The Motley Fool's premium services.
[View Premium Services](https://www.fool.com/services/?ftm_cam=footer-services-sitewide-prospects)
[](https://www.fool.com/)
Making the world smarter, happier, and richer.
- [Facebook](https://www.facebook.com/themotleyfool)
- [Twitter](https://x.com/TheMotleyFool)
- [LinkedIn](https://www.linkedin.com/company/the-motley-fool/)
- [Pinterest](https://www.pinterest.com/themotleyfool/)
- [YouTube](https://www.youtube.com/user/TheMotleyFool)
- [Instagram](https://www.instagram.com/themotleyfoolofficial/)
- [TikTok](https://www.tiktok.com/@themotleyfoolofficial)
© 1995 - 2026 The Motley Fool. All rights reserved.
Market data powered by [Xignite](https://xignite.com/) and [Polygon.io](https://polygon.io/).
About The Motley Fool
- [About Us](https://www.fool.com/about/)
- [Careers](https://careers.fool.com/)
- [Research](https://www.fool.com/research/)
- [Newsroom](https://www.fool.com/contact/newsroom/)
- [Contact](https://www.fool.com/legal/contact-us/)
- [Advertise](https://www.fool.com/cdn-cgi/l/email-protection#81e0e5e8eff0f4e8f3e8e4f2c1e7eeeeedafe2eeec)
Our Services
- [All Services](https://www.fool.com/services/)
- [Stock Advisor](https://www.fool.com/services/stock-advisor/)
- [Epic](https://www.fool.com/services/epic/)
- [Epic Plus](https://www.fool.com/services/epic-plus/)
- [Fool Portfolios](https://www.fool.com/services/fool-portfolios/)
- [Fool One](https://www.fool.com/services/one/)
- [Motley Fool Money](https://www.fool.com/money/)
Around the Globe
- [Fool UK](https://www.fool.co.uk/)
- [Fool Australia](https://www.fool.com.au/)
- [Fool Canada](https://www.fool.ca/)
Free Tools
- [CAPS Stock Ratings](https://caps.fool.com/)
- [Discussion Boards](https://discussion.fool.com/)
- [Calculators](https://www.fool.com/calculators/index/)
- [Financial Dictionary](https://www.fool.com/terms/)
Affiliates & Friends
- [Motley Fool Asset Management](https://www.fool.com/affiliates/mfam/)
- [Motley Fool Wealth Management](https://www.fool.com/affiliates/mfwm/)
- [Motley Fool Ventures](https://www.fool.com/affiliates/ventures/)
- [Fool Community Foundation](https://www.fool.com/affiliates/foundation/)
- [Become an Affiliate Partner](https://www.fool.com/affiliates/)
- [Terms of Use](https://www.fool.com/legal/terms-and-conditions/fool-rules/ "Terms of Use")
- [Privacy Policy](https://www.fool.com/legal/privacy-statement/ "Privacy Policy")
- [Disclosure Policy](https://www.fool.com/legal/fool-disclosure-policy/ "Disclosure Policy")
- [Accessibility Policy](https://www.fool.com/legal/accessibility-policy/ "Accessibility Policy")
- [Copyright, Trademark and Patent Information](https://www.fool.com/legal/stuff-we-own/ "Copyright, Trademark and Patent Information")
- [Terms and Conditions](https://www.fool.com/legal/terms-and-conditions/ "Terms and Conditions")
- [Do Not Sell My Personal Information](https://www.fool.com/data-protection/ccpa-update/ "Do Not Sell My Personal Information") | |||||||||
| Readable Markdown | Annualized volatility measures how much a stock price varies over one year. Many investors use volatility to define the riskiness of a stock, bond, or asset class. In addition, assumptions about volatility are used to price [options](https://www.fool.com/terms/o/options/).

Image source: Getty Images.
No investor invests without comparing risk to reward, so annualized volatility is integral to any investor's toolbox. We'll outline how to calculate volatility and provide an example to serve as a reference point for readers interested in the concept.
## What is volatility?
The most common way to [measure volatility in finance](https://www.fool.com/terms/s/stock-market-volatility/) is through standard deviation. This is a mathematical expression of how much a variable can differ from its average.
To help investors grasp the concept of volatility, consider investing in two funds. Fund A has returned 10% each year over the last three years. Fund B has returned 8%, 12%, and 10%.
Both funds have an average [yearly return](https://www.fool.com/investing/how-to-invest/stocks/how-to-convert-daily-returns-to-annual-returns/) of 10%, but Fund B is more volatile because its returns vary more. Using a simple Excel worksheet and the standard deviation function (stdev), you can see that Fund A's standard deviation is zero (meaning its returns don't vary around the mean). In contrast, the standard deviation for Fund B is 2%.
Assuming a normal distribution -- a bell-shaped curve that assumes 68% of variables are within one standard deviation from the mean and 95% of variables are within two standard deviations -- you could argue the following for Fund B:
- 68% of the time, the fund will generate a return between 8% and 12%.
- 95% of the time, the fund will generate a return between 6% and 14%.
The above example is simplified to illustrate a point. However, in the real world, investors won't always have the time or patience to wait years to calculate potential returns and volatility.
That's where the idea of annualized volatility comes in. By annualizing short-term data, investors can know [how volatile a stock will be](https://www.fool.com/investing/stock-market/types-of-stocks/volatile-stocks/) over the course of a year just by using the data. In this case, I will illustrate the concept by examining the monthly returns on two U.S.-listed stocks.
## Annualized volatility formula
But first, here's a look at the formula for [calculating annualized volatility](https://www.fool.com/investing/how-to-invest/stocks/how-to-calculate-stock-volatility/).
- Annualized volatility = standard deviation (volatility) multiplied by the square root of the periods in the year.
For example, you might calculate the volatility of daily stock returns. Since there are roughly 252 trading days in the year, you multiply the square root of 252 (15.9) by the daily volatility to get the annualized volatility. (We'll use monthly returns in the case below, so the time period will be 12 times a year.)
## Calculating a stock's volatility
The chart below shows the monthly returns for two stocks. Just from the chart's appearance, Stock A is more volatile than Stock B, but this needs to be expressed mathematically.

Data source: author's analysis.
The first step is to calculate the monthly volatility of each stock's return. You can easily do this using an Excel spreadsheet and calculating the standard deviation (stdev function) of the 12 monthly returns for each [stock](), as shown in the chart above.
Doing this gives a monthly standard deviation (volatility) of 17.9% for Stock A and just 3.6% for Stock B. This confirms the optics in the chart. In other words, Stock A is a more volatile -- and, some might say, riskier -- investment than Stock B.
## Annualizing volatility
Returning to the formula for annualized volatility, the figures above are monthly returns. There are 12 months in the year, so the annualized volatility is calculated by multiplying the square root of 12 by the monthly volatility. Here's how we calculate annualized volatility for the two stocks:
- Stock A annualized volatility = 17.9% multiplied by the square root of 12, resulting in 62%
- Stock B annualized volatility = 3.6% multiplied by the square root of 12, resulting in 12.5%
We can see that Stock A is notably more volatile than Stock B, which might be a factor to consider when [investing in stocks](https://www.fool.com/investing/how-to-invest/stocks/).
## The bottom line on calculating annualized volatility
It's important to remember that annualized volatility is just one of many tools investors must consider. The history of investing is full of [investment strategies]() that demonstrated low volatility and good returns -- right before they blew up in an investor's face.
In addition, the data is always historical, and there's no guarantee that stock returns will follow historical patterns. The assumption that volatility or standard deviation is equivalent to risk is also an open question.
## Related investing topics
For example, going back to the first example above, Fund B is *seen* as riskier because its returns are more volatile than Fund A. However, the implied annual return is precisely the same at 10% for both funds. All told, volatility and annualized volatility are simply useful concepts that can serve as a starting point for thinking about [risk and reward](https://www.fool.com/research/gen-z-millennial-investors-risk/) in investing.
FAQ
### About the Author

Lee Samaha is a contributing Stock Market Analyst at The Motley Fool covering industrials, electricals, energy, materials, transportation, and infrastructure stocks. Prior to The Motley Fool, Lee was a Civil Engineer and Investment Manager. He holds a Bachelor of Civil and Structural Engineering from Southampton University and a Certificate in Investment Management from Chartered Institute for Securities & Investment. Lee first cut his investing teeth on The Motley Fool bulletin boards (commonly referred to as the “Fool Boards,”) and he’s infinitely grateful to all of the investors he learned from in this powerful investing community.
The Motley Fool has a [disclosure policy](https://www.fool.com/legal/fool-disclosure-policy/). | |||||||||
| ML Classification | ||||||||||
| ML Categories |
Raw JSON{
"/Finance": 998,
"/Finance/Investing": 987,
"/Finance/Investing/Stocks_and_Bonds": 877
} | |||||||||
| ML Page Types |
Raw JSON{
"/Article": 999,
"/Article/How_to": 750
} | |||||||||
| ML Intent Types |
Raw JSON{
"Informational": 999
} | |||||||||
| Content Metadata | ||||||||||
| Language | en | |||||||||
| Author | Lee Samaha | |||||||||
| Publish Time | 2025-05-01 02:20:18 (11 months ago) | |||||||||
| Original Publish Time | 2024-03-12 01:35:28 (2 years ago) | |||||||||
| Republished | Yes | |||||||||
| Word Count (Total) | 1,850 | |||||||||
| Word Count (Content) | 931 | |||||||||
| Links | ||||||||||
| External Links | 21 | |||||||||
| Internal Links | 167 | |||||||||
| Technical SEO | ||||||||||
| Meta Nofollow | No | |||||||||
| Meta Noarchive | No | |||||||||
| JS Rendered | Yes | |||||||||
| Redirect Target | null | |||||||||
| Performance | ||||||||||
| Download Time (ms) | 458 | |||||||||
| TTFB (ms) | 457 | |||||||||
| Download Size (bytes) | 46,549 | |||||||||
| Shard | 88 (laksa) | |||||||||
| Root Hash | 16263700115757751488 | |||||||||
| Unparsed URL | com,fool!www,/investing/how-to-calculate/annualized-volatility/ s443 | |||||||||