ℹ️ Skipped - page is already crawled
| Filter | Status | Condition | Details |
|---|---|---|---|
| HTTP status | PASS | download_http_code = 200 | HTTP 200 |
| Age cutoff | PASS | download_stamp > now() - 6 MONTH | 0.2 months ago |
| History drop | PASS | isNull(history_drop_reason) | No drop reason |
| Spam/ban | PASS | fh_dont_index != 1 AND ml_spam_score = 0 | ml_spam_score=0 |
| Canonical | PASS | meta_canonical IS NULL OR = '' OR = src_unparsed | Not set |
| Property | Value | |||||||||
|---|---|---|---|---|---|---|---|---|---|---|
| URL | https://www.datacamp.com/tutorial/central-limit-theorem | |||||||||
| Last Crawled | 2026-04-16 08:08:19 (6 days ago) | |||||||||
| First Indexed | 2025-04-02 21:43:10 (1 year ago) | |||||||||
| HTTP Status Code | 200 | |||||||||
| Content | ||||||||||
| Meta Title | Central Limit Theorem: A Key Concept in Statistics Explained | DataCamp | |||||||||
| Meta Description | The central limit theorem explains why the distribution of sample means approaches a normal distribution even when the original data isn't normally distributed. | |||||||||
| Meta Canonical | null | |||||||||
| Boilerpipe Text | Home
Tutorials
Data Science
The central limit theorem states that, with a sufficiently large sample size, the sampling distribution of the mean will be normally distributed, regardless of the population’s distribution. Learn its formula, key conditions, and applications in statistics and machine learning.
Apr 2, 2025
· 8 min read
Author
Laiba Siddiqui
Topics
Learn with DataCamp
Course
Foundations of Probability in R
4 hr
41.8K
In this course, you'll learn about the concepts of random variables, distributions, and conditioning.
Course
Foundations of Probability in Python
5 hr
15.5K
Learn fundamental probability concepts like random variables, mean and variance, probability distributions, and conditional probabilities.
Course
Sampling in Python
4 hr
52.4K
Learn to draw conclusions from limited data using Python and statistics. This course covers everything from random sampling to stratified and cluster sampling.
See More
Right Arrow | |||||||||
| Markdown | [ Last chance! **50% off** DataCamp Premium Sale ends in 3d15h55m07s Buy Now](https://www.datacamp.com/promo/flash-sale-apr-26)
[Skip to main content](https://www.datacamp.com/tutorial/central-limit-theorem#main)
EN
[English](https://www.datacamp.com/tutorial/central-limit-theorem)[Español](https://www.datacamp.com/es/tutorial/central-limit-theorem)[Português](https://www.datacamp.com/pt/tutorial/central-limit-theorem)[DeutschBeta](https://www.datacamp.com/de/tutorial/central-limit-theorem)[FrançaisBeta](https://www.datacamp.com/fr/tutorial/central-limit-theorem)[ItalianoBeta](https://www.datacamp.com/it/tutorial/central-limit-theorem)[TürkçeBeta](https://www.datacamp.com/tr/tutorial/central-limit-theorem)[Bahasa IndonesiaBeta](https://www.datacamp.com/id/tutorial/central-limit-theorem)[Tiếng ViệtBeta](https://www.datacamp.com/vi/tutorial/central-limit-theorem)[NederlandsBeta](https://www.datacamp.com/nl/tutorial/central-limit-theorem)[हिन्दीBeta](https://www.datacamp.com/hi/tutorial/central-limit-theorem)[日本語Beta](https://www.datacamp.com/ja/tutorial/central-limit-theorem)[한국어Beta](https://www.datacamp.com/ko/tutorial/central-limit-theorem)[PolskiBeta](https://www.datacamp.com/pl/tutorial/central-limit-theorem)[RomânăBeta](https://www.datacamp.com/ro/tutorial/central-limit-theorem)[РусскийBeta](https://www.datacamp.com/ru/tutorial/central-limit-theorem)[SvenskaBeta](https://www.datacamp.com/sv/tutorial/central-limit-theorem)[ไทยBeta](https://www.datacamp.com/th/tutorial/central-limit-theorem)[中文(简体)Beta](https://www.datacamp.com/zh/tutorial/central-limit-theorem)
***
[More Information](https://support.datacamp.com/hc/en-us/articles/21821832799255-Languages-Available-on-DataCamp)
[Found an Error?]()
[Log in](https://www.datacamp.com/users/sign_in?redirect=%2Ftutorial%2Fcentral-limit-theorem)[Get Started](https://www.datacamp.com/users/sign_up?redirect=%2Ftutorial%2Fcentral-limit-theorem)
Tutorials
[Blogs](https://www.datacamp.com/blog)
[Tutorials](https://www.datacamp.com/tutorial)
[docs](https://www.datacamp.com/doc)
[Podcasts](https://www.datacamp.com/podcast)
[Cheat Sheets](https://www.datacamp.com/cheat-sheet)
[code-alongs](https://www.datacamp.com/code-along)
[Newsletter](https://dcthemedian.substack.com/)
Category
Category
Technologies
Discover content by tools and technology
[AI Agents](https://www.datacamp.com/tutorial/category/ai-agents)[AI News](https://www.datacamp.com/tutorial/category/ai-news)[Artificial Intelligence](https://www.datacamp.com/tutorial/category/ai)[AWS](https://www.datacamp.com/tutorial/category/aws)[Azure](https://www.datacamp.com/tutorial/category/microsoft-azure)[Business Intelligence](https://www.datacamp.com/tutorial/category/learn-business-intelligence)[ChatGPT](https://www.datacamp.com/tutorial/category/chatgpt)[Databricks](https://www.datacamp.com/tutorial/category/databricks)[dbt](https://www.datacamp.com/tutorial/category/dbt)[Docker](https://www.datacamp.com/tutorial/category/docker)[Excel](https://www.datacamp.com/tutorial/category/excel)[Generative AI](https://www.datacamp.com/tutorial/category/generative-ai)[Git](https://www.datacamp.com/tutorial/category/git)[Google Cloud Platform](https://www.datacamp.com/tutorial/category/google-cloud-platform)[Hugging Face](https://www.datacamp.com/tutorial/category/Hugging-Face)[Java](https://www.datacamp.com/tutorial/category/java)[Julia](https://www.datacamp.com/tutorial/category/julia)[Kafka](https://www.datacamp.com/tutorial/category/apache-kafka)[Kubernetes](https://www.datacamp.com/tutorial/category/kubernetes)[Large Language Models](https://www.datacamp.com/tutorial/category/large-language-models)[MongoDB](https://www.datacamp.com/tutorial/category/mongodb)[MySQL](https://www.datacamp.com/tutorial/category/mysql)[NoSQL](https://www.datacamp.com/tutorial/category/nosql)[OpenAI](https://www.datacamp.com/tutorial/category/OpenAI)[PostgreSQL](https://www.datacamp.com/tutorial/category/postgresql)[Power BI](https://www.datacamp.com/tutorial/category/power-bi)[PySpark](https://www.datacamp.com/tutorial/category/pyspark)[Python](https://www.datacamp.com/tutorial/category/python)[R](https://www.datacamp.com/tutorial/category/r-programming)[Scala](https://www.datacamp.com/tutorial/category/scala)[Snowflake](https://www.datacamp.com/tutorial/category/snowflake)[Spreadsheets](https://www.datacamp.com/tutorial/category/spreadsheets)[SQL](https://www.datacamp.com/tutorial/category/sql)[SQLite](https://www.datacamp.com/tutorial/category/sqlite)[Tableau](https://www.datacamp.com/tutorial/category/tableau)
Category
Topics
Discover content by data science topics
[AI for Business](https://www.datacamp.com/tutorial/category/ai-for-business)[Big Data](https://www.datacamp.com/tutorial/category/big-data)[Career Services](https://www.datacamp.com/tutorial/category/career-services)[Cloud](https://www.datacamp.com/tutorial/category/cloud)[Data Analysis](https://www.datacamp.com/tutorial/category/data-analysis)[Data Engineering](https://www.datacamp.com/tutorial/category/data-engineering)[Data Literacy](https://www.datacamp.com/tutorial/category/data-literacy)[Data Science](https://www.datacamp.com/tutorial/category/data-science)[Data Visualization](https://www.datacamp.com/tutorial/category/data-visualization)[DataLab](https://www.datacamp.com/tutorial/category/datalab)[Deep Learning](https://www.datacamp.com/tutorial/category/deep-learning)[Machine Learning](https://www.datacamp.com/tutorial/category/machine-learning)[MLOps](https://www.datacamp.com/tutorial/category/mlops)[Natural Language Processing](https://www.datacamp.com/tutorial/category/natural-language-processing)[Vector Databases](https://www.datacamp.com/tutorial/category/vector-databases)
[Browse Courses](https://www.datacamp.com/courses-all)
category
1. [Home](https://www.datacamp.com/)
2. [Tutorials](https://www.datacamp.com/tutorial)
3. [Data Science](https://www.datacamp.com/tutorial/category/data-science)
# Central Limit Theorem: A Key Concept in Statistics Explained
The central limit theorem states that, with a sufficiently large sample size, the sampling distribution of the mean will be normally distributed, regardless of the population’s distribution. Learn its formula, key conditions, and applications in statistics and machine learning.
Contents
Apr 2, 2025 · 8 min read
Contents
- [What Is the Central Limit Theorem?](https://www.datacamp.com/tutorial/central-limit-theorem#what-is-the-central-limit-theorem?-thece)
- [Central Limit Theorem Formula](https://www.datacamp.com/tutorial/central-limit-theorem#central-limit-theorem-formula-<span)
- [Central Limit Theorem Conditions](https://www.datacamp.com/tutorial/central-limit-theorem#central-limit-theorem-conditions-<span)
- [Central Limit Theorem Examples](https://www.datacamp.com/tutorial/central-limit-theorem#central-limit-theorem-examples-<span)
- [Why the Central Limit Theorem Matters](https://www.datacamp.com/tutorial/central-limit-theorem#why-the-central-limit-theorem-matters-<span)
- [Statistical inference](https://www.datacamp.com/tutorial/central-limit-theorem#statistical-inference-insta)
- [Industry applications](https://www.datacamp.com/tutorial/central-limit-theorem#industry-applications-<span)
- [Central Limit Theorem Calculator](https://www.datacamp.com/tutorial/central-limit-theorem#central-limit-theorem-calculator-<span)
- [The Central Limit Theorem in Data Science](https://www.datacamp.com/tutorial/central-limit-theorem#the-central-limit-theorem-in-data-science-<span)
- [Final Thoughts](https://www.datacamp.com/tutorial/central-limit-theorem#final-thoughts-thece)
- [Central Limit Theorem FAQs](https://www.datacamp.com/tutorial/central-limit-theorem#faq)
## Training more people?
Get your team access to the full DataCamp for business platform.
[For Business](https://www.datacamp.com/business)For a bespoke solution [book a demo](https://www.datacamp.com/business/demo-2).
If we take lots of random samples from pretty much any type of data distribution, something surprising happens. The average of those samples starts to look like a [normal distribution](https://www.datacamp.com/tutorial/gaussian-distribution) – that familiar bell-shaped curve. That’s the central limit theorem (CLT) in a nutshell.
It’s a big deal in probability and statistics because it means we can make accurate predictions and draw conclusions about whole populations, even when only looking at small samples.
What makes the CLT extra useful is that it works even if the original data isn’t normally distributed. Let’s explore this in detail and see how we can calculate it.
## What Is the Central Limit Theorem?
The central limit theorem, or CLT, is an idea in [statistics](https://www.datacamp.com/courses/introduction-to-statistics) that says that if we take a bunch of random samples from any population and look at the averages of those samples, those averages will start to form a normal, bell-shaped curve even if the original population doesn’t look normal at all.
This connects to the law of large numbers, which tells us that as we collect more data, our sample average gets closer and closer to the true average of the whole population. The CLT takes that a step further — it tells us that the sample average becomes more accurate and that the pattern of those averages becomes predictable. Our [Intro to Statistics](https://www.datacamp.com/courses/introduction-to-statistics) course has practice exercises to get you familiar with the relationship and differences between the CLT and the law of large numbers, if you want to explore this part further.
A great way to see this in action is by rolling a die. If we roll it just once, we get a random number between 1 and 6. But after enough rolls, the average will settle around 3.5 (the true average value of a fair die). Do this repeatedly, and the distribution of those averages starts to look like a normal curve.
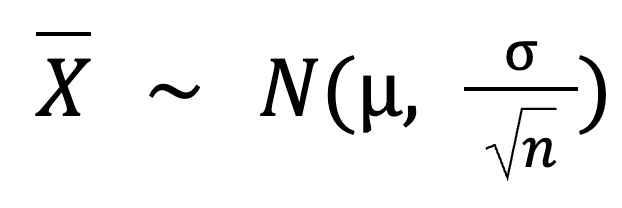
## Central Limit Theorem Formula
Here’s the basic formula for the central limit theorem:

In this formula:
- `X` is the sampling distribution of the sample mean, which follows a normal distribution.
- `N` is the normal distribution.
- `𝜇` is the population mean.
- `σ` is the population standard deviation.
- `n` is the sample size.
As the sample size gets bigger, the standard deviation of the sampling distribution gets smaller. The more data we collect, the more tightly our sample means will cluster around the true population mean.
## Central Limit Theorem Conditions
Now, for the central limit theorem to work the way we expect, there are a few conditions to consider:
- Sufficiently large sample size: The sample size has to be large enough. A sample size of 30 or more is usually considered good. But if the population we’re sampling from is skewed or has many outliers, we may need a bigger sample to see that nice, bell-shaped curve show up.
- Independent and Identically Distributed (i.i.d.) samples: The samples we take need to be independent and identically distributed(i.i.d.). This means each sample is chosen randomly and comes from the same population. If that’s not true, then the results may not be reliable.
- **Finite population variance**: The population we’re sampling must have a finite variance. If the data comes from a distribution with infinite variance, like the [Cauchy distribution](https://www.datacamp.com/tutorial/cauchy-distribution), the CLT won’t apply to those.
## Central Limit Theorem Examples
Let’s say we want to know how many cups of coffee are sold per day at a local coffee shop. Over the years, the number of cups sold each day may follow a distribution similar to the one I'm including here. Most days, they sell between 80 and 120 cups. But on busy days like holidays or special events, they sell 150 or even 180 cups. The data is a bit skewed (uneven) in this case.
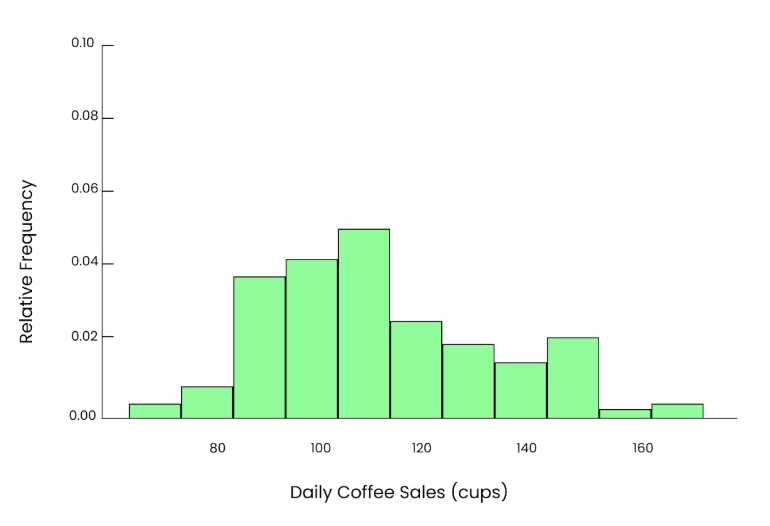
Uneven graph. Image by Author.
Let’s say we take a small sample. We randomly pick 5 days from the year and look at how many cups were sold on those days.
```
95, 102, 85, 110, 120Powered ByWas this AI assistant helpful? Yes No
```
The mean we get from this sample is:
```
Mean = 95+102+85+110+1205 = 102.4 cupsPowered ByWas this AI assistant helpful? Yes No
```
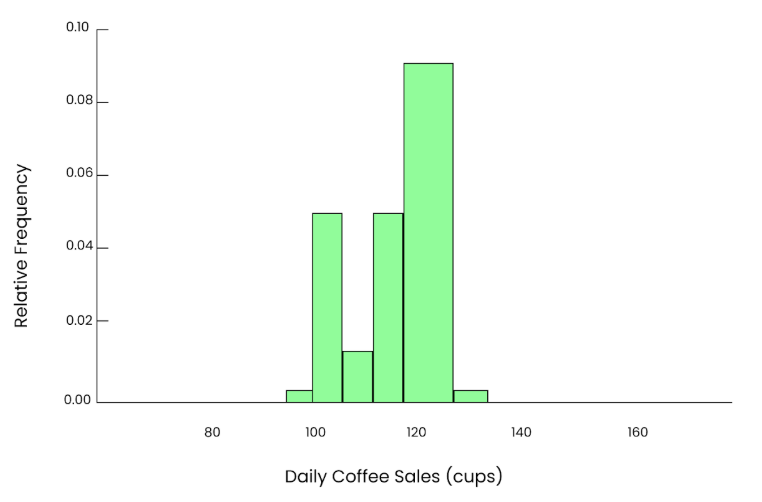
Graph of 5 cups. Image by Author.
That gives us one estimate of the population mean, but since the sample is small, it may not be exact. If we repeat this process 10 times, randomly pick 5 days each time, calculate the mean, and write down the results. The 10 sample means would be:
```
97.6, 105.8, 93.4, 110.2, 99.0, 102.4, 101.2, 107.5, 96.3, 94.1Powered ByWas this AI assistant helpful? Yes No
```
If we plot these values in a histogram, we’ll see a rough bell shape, but it may still look uneven. And the spread of these means is smaller than the spread in the population.
Graph of 10 cups. Image by Author.
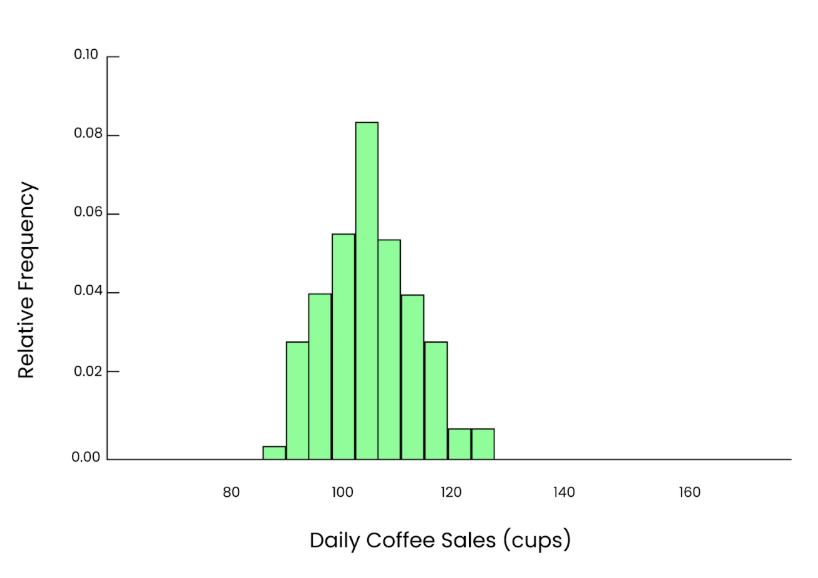
Now, let’s take a bigger sample. This time, we randomly select 50 days and calculate the mean number of cups sold:
```
Powered ByWas this AI assistant helpful? Yes No
```
When we calculate the mean of this sample, we get:
```
Mean = 101.2 cupsPowered ByWas this AI assistant helpful? Yes No
```
This estimate is much closer to the population mean of 100, and because our sample size is larger, it’s a more precise estimate.
If we repeat this process many times, each time randomly selecting 50 days, calculating the mean, and plotting those means in a histogram, even though the original data was skewed, we’ll see an apparent, smooth bell-shaped curve. So, that’s the power of the central limit theorem.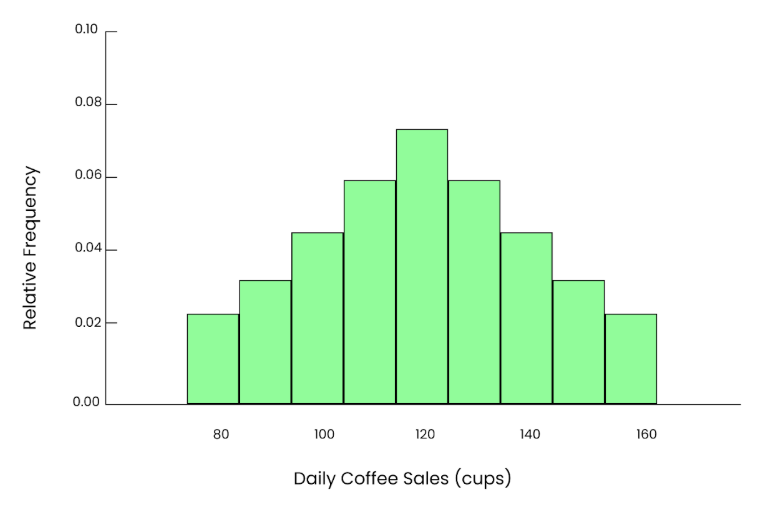
Even graph. Image by Author.
We can even calculate that spread using this formula:
Here:
- `µ`(population mean) = 100
- `σ` (population standard deviation) = 15
- `n` (sample size) = 50
So, the standard deviation of our sample means is:
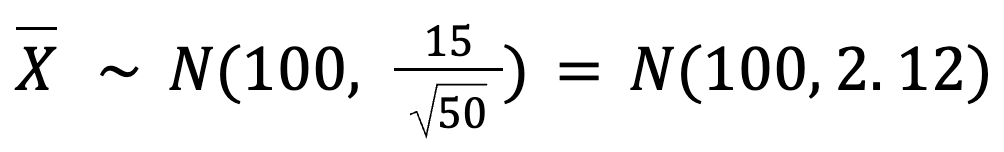
This tells us that the sample means will be very close to 100 cups with just a small variation (around 2.12 cups).
## Why the Central Limit Theorem Matters
Now we know data in the real world can be weird and unpredictable. But the central limit theorem gives us a reliable way to understand what’s going on and make better choices based on it. Let’s understand its importance in more detail.
### Statistical inference
In statistics, the central limit theorem is the reason why parametric tests like [t-tests](https://www.datacamp.com/tutorial/an-introduction-to-python-t-tests), [ANOVA](https://www.datacamp.com/tutorial/anova-test), and [regression](https://www.datacamp.com/tutorial/simple-linear-regression) work the way they do. These tests are based on the idea that sample data comes from a population with fixed characteristics.
Without the central limit theorem, we wouldn’t be able to rely on those tests. And because of this theorem, parametric tests are often more potent than non-parametric ones, which don’t make assumptions about the data’s distribution.
### Industry applications
It also shows up in a lot of real-world situations. In finance, analysts use it to estimate average stock returns based on past performance. In polling and surveys, it makes predictions about the entire population by collecting a sample of responses. In machine learning and big data, we use it where models are trained on samples. For example, a movie app may use a sample of user activity to build its recommendation system.
## Central Limit Theorem Calculator
Standard deviation is a number that tells us how spread the values are from the average. When we look at sample means (the averages from different samples), we want to know how much those averages vary. For that, we can use this formula:
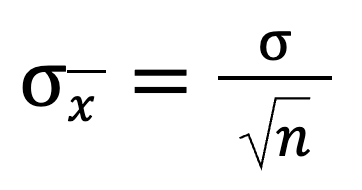
This tells us that when we divide the population standard deviation by the square root of the sample size, we get the standard deviation of the sampling distribution. As the sample size gets bigger, the overall value gets smaller.
Let’s look at a quick example:
| Sample Size (n) | Sample Mean (μₓ̄) | Std. Deviation (σₓ̄) |
|---|---|---|
| 5 | 17 | 1\.788854 |
| 10 | 17 | 1\.264911 |
| 25 | 17 | 0\.800000 |
| 50 | 17 | 0\.565685 |
| 100 | 17 | 0\.400000 |
You can see that the mean stays the same, but the standard deviation keeps shrinking. This shows that the bigger the sample, the more accurate and consistent it is.
## The Central Limit Theorem in Data Science
In data science, we usually deal with samples, not whole populations. The CLT helps us understand how those sample results behave and it tells us that if we take enough samples, their averages will start to look like a normal distribution, even if the original data is anything but.
This has some big real-world perks too. In machine learning, we often use techniques like [bootstrapping](https://www.datacamp.com/tutorial/bootstrapping) to estimate values. Thanks to the CLT, we can be confident that those estimates are accurate.
It’s also a key player in [A/B testing](https://www.datacamp.com/courses/ab-testing-in-r). When a company tries out two versions of a webpage or feature, the CLT helps us figure out whether the results are meaningful or random noise.
Even in [reinforcement learning](https://www.datacamp.com/tracks/reinforcement-learning), where systems learn by trial and error, the CLT irons out the chaos. As more data rolls in, the averages become more stable, which helps the system learn faster and better.
Finally, you’ll also spot the CLT in [hypothesis testing](https://www.datacamp.com/tutorial/hypothesis-testing) and [time series analysis](https://www.datacamp.com/tutorial/time%20series%20analysis). It helps data scientists test ideas and track trends with more confidence.
## Final Thoughts
The central limit theorem may sound technical if you’re new to stats, but it’s a big reason we can do smart things with data. It turns randomness into something we can understand and trust. In fact, it’s one of the building blocks of [statistical modeling](https://www.datacamp.com/podcast/robust-data-science-with-statistical-modeling) and a must-know for anyone who works with data.
If you want to explore more, read up on the law of large numbers and [probability distributions](https://www.datacamp.com/tutorial/probability-distributions-python) — they all tie together.
***
Author
Laiba Siddiqui
I'm a content strategist who loves simplifying complex topics. I’ve helped companies like Splunk, Hackernoon, and Tiiny Host create engaging and informative content for their audiences.
## Central Limit Theorem FAQs
### Can the central limit theorem be used with non-numerical data?
**Yes, but not directly. The CLT applies to numerical data, especially means and sums. However, for categorical or ordinal data, you can still use similar principles by converting the data into numerical form or using other statistical techniques.**
### What’s the difference between sampling distribution and population distribution?
**The population distribution describes the full dataset, while the sampling distribution refers to the distribution of sample statistics (like means) from repeated sampling.**
### How do outliers affect the central limit theorem?
****Outliers increase skewness and variance, meaning we may need a larger sample size for the sampling distribution to approximate normality.****
Topics
[Data Science](https://www.datacamp.com/tutorial/category/data-science)
[Data Analysis](https://www.datacamp.com/tutorial/category/data-analysis)
***
Laiba SiddiquiI'm a content strategist who loves simplifying complex topics.
***
Topics
[Data Science](https://www.datacamp.com/tutorial/category/data-science)
[Data Analysis](https://www.datacamp.com/tutorial/category/data-analysis)

[The Standard Normal Distribution: What It Is and Why It Matters](https://www.datacamp.com/blog/standard-normal-distribution)
[Gaussian Distribution: A Comprehensive Guide](https://www.datacamp.com/tutorial/gaussian-distribution)
[Sample Standard Deviation: The Key Ideas](https://www.datacamp.com/tutorial/sample-standard-deviation)
[Cauchy Distribution: Understanding Heavy-Tailed Data](https://www.datacamp.com/tutorial/cauchy-distribution)
[Arithmetic Mean: A Foundational Tool for Data Analysis](https://www.datacamp.com/tutorial/arithmetic-mean)

[Hypothesis Testing Made Easy](https://www.datacamp.com/tutorial/hypothesis-testing)
Learn with DataCamp
Course
### [Foundations of Probability in R](https://www.datacamp.com/courses/foundations-of-probability-in-r)
4 hr
41\.8K
In this course, you'll learn about the concepts of random variables, distributions, and conditioning.
[See Details](https://www.datacamp.com/courses/foundations-of-probability-in-r)
[Start Course](https://www.datacamp.com/users/sign_up?redirect=%2Fcourses%2Ffoundations-of-probability-in-r%2Fcontinue)
Course
### [Foundations of Probability in Python](https://www.datacamp.com/courses/foundations-of-probability-in-python)
5 hr
15\.5K
Learn fundamental probability concepts like random variables, mean and variance, probability distributions, and conditional probabilities.
[See Details](https://www.datacamp.com/courses/foundations-of-probability-in-python)
[Start Course](https://www.datacamp.com/users/sign_up?redirect=%2Fcourses%2Ffoundations-of-probability-in-python%2Fcontinue)
Course
### [Sampling in Python](https://www.datacamp.com/courses/sampling-in-python)
4 hr
52\.4K
Learn to draw conclusions from limited data using Python and statistics. This course covers everything from random sampling to stratified and cluster sampling.
[See Details](https://www.datacamp.com/courses/sampling-in-python)
[Start Course](https://www.datacamp.com/users/sign_up?redirect=%2Fcourses%2Fsampling-in-python%2Fcontinue)
[See More](https://www.datacamp.com/category/probability-and-statistics)
Related

[blogThe Standard Normal Distribution: What It Is and Why It Matters](https://www.datacamp.com/blog/standard-normal-distribution)
Discover the fundamentals of the standard normal distribution and its significance in statistics, data science, and machine learning. Learn how to apply this concept to real-world data analysis.
Josef Waples
10 min
[TutorialGaussian Distribution: A Comprehensive Guide](https://www.datacamp.com/tutorial/gaussian-distribution)
Uncover the significance of the Gaussian distribution, its relationship to the central limit theorem, and its real-world applications in machine learning and hypothesis testing.
Vinod Chugani
[TutorialSample Standard Deviation: The Key Ideas](https://www.datacamp.com/tutorial/sample-standard-deviation)
Learn how to calculate sample standard deviation and understand its significance in statistical analysis. Explore examples and best practices for real-world data interpretation.
Allan Ouko
[TutorialCauchy Distribution: Understanding Heavy-Tailed Data](https://www.datacamp.com/tutorial/cauchy-distribution)
Explore heavy-tailed distributions where traditional statistical methods don't apply. Discover how the Cauchy distribution effectively models phenomena where extreme events occur more frequently than expected.
Vinod Chugani
[TutorialArithmetic Mean: A Foundational Tool for Data Analysis](https://www.datacamp.com/tutorial/arithmetic-mean)
Explore the arithmetic mean's role in data analysis. Learn its formula, applications, and how it compares to other kinds of means and other statistical measures, and understand when each is most useful.
Vinod Chugani

[TutorialHypothesis Testing Made Easy](https://www.datacamp.com/tutorial/hypothesis-testing)
Hypothesis testing is a statistical method used to evaluate claims about populations based on sample data.
Vinod Chugani
[See More](https://www.datacamp.com/tutorial/category/data-science)
[See More](https://www.datacamp.com/tutorial/category/data-science)
## Grow your data skills with DataCamp for Mobile
Make progress on the go with our mobile courses and daily 5-minute coding challenges.
[Download on the App Store](https://datacamp.onelink.me/xztQ/45dozwue?deep_link_sub1=%7B%22src_url%22%3A%22https%3A%2F%2Fwww.datacamp.com%2Ftutorial%2Fcentral-limit-theorem%22%7D)[Get it on Google Play](https://datacamp.onelink.me/xztQ/go2f19ij?deep_link_sub1=%7B%22src_url%22%3A%22https%3A%2F%2Fwww.datacamp.com%2Ftutorial%2Fcentral-limit-theorem%22%7D)
**Learn**
[Learn Python](https://www.datacamp.com/blog/how-to-learn-python-expert-guide)[Learn AI](https://www.datacamp.com/blog/how-to-learn-ai)[Learn Power BI](https://www.datacamp.com/learn/power-bi)[Learn Data Engineering](https://www.datacamp.com/category/data-engineering)[Assessments](https://www.datacamp.com/signal)[Career Tracks](https://www.datacamp.com/tracks/career)[Skill Tracks](https://www.datacamp.com/tracks/skill)[Courses](https://www.datacamp.com/courses-all)[Data Science Roadmap](https://www.datacamp.com/blog/data-science-roadmap)
**Data Courses**
[Python Courses](https://www.datacamp.com/category/python)[R Courses](https://www.datacamp.com/category/r)[SQL Courses](https://www.datacamp.com/category/sql)[Power BI Courses](https://www.datacamp.com/category/power-bi)[Tableau Courses](https://www.datacamp.com/category/tableau)[Alteryx Courses](https://www.datacamp.com/category/alteryx)[Azure Courses](https://www.datacamp.com/category/azure)[AWS Courses](https://www.datacamp.com/category/aws)[Google Cloud Courses](https://www.datacamp.com/category/google-cloud)[Google Sheets Courses](https://www.datacamp.com/category/google-sheets)[Excel Courses](https://www.datacamp.com/category/excel)[AI Courses](https://www.datacamp.com/category/artificial-intelligence)[Data Analysis Courses](https://www.datacamp.com/category/data-analysis)[Data Visualization Courses](https://www.datacamp.com/category/data-visualization)[Machine Learning Courses](https://www.datacamp.com/category/machine-learning)[Data Engineering Courses](https://www.datacamp.com/category/data-engineering)[Probability & Statistics Courses](https://www.datacamp.com/category/probability-and-statistics)
**DataLab**
[Get Started](https://www.datacamp.com/datalab)[Pricing](https://www.datacamp.com/datalab/pricing)[Security](https://www.datacamp.com/datalab/security)[Documentation](https://datalab-docs.datacamp.com/)
**Certification**
[Certifications](https://www.datacamp.com/certification)[Data Scientist](https://www.datacamp.com/certification/data-scientist)[Data Analyst](https://www.datacamp.com/certification/data-analyst)[Data Engineer](https://www.datacamp.com/certification/data-engineer)[SQL Associate](https://www.datacamp.com/certification/sql-associate)[Power BI Data Analyst](https://www.datacamp.com/certification/data-analyst-in-power-bi)[Tableau Certified Data Analyst](https://www.datacamp.com/certification/data-analyst-in-tableau)[Azure Fundamentals](https://www.datacamp.com/certification/azure-fundamentals)[AI Fundamentals](https://www.datacamp.com/certification/ai-fundamentals)
**Resources**
[Resource Center](https://www.datacamp.com/resources)[Upcoming Events](https://www.datacamp.com/webinars)[Blog](https://www.datacamp.com/blog)[Code-Alongs](https://www.datacamp.com/code-along)[Tutorials](https://www.datacamp.com/tutorial)[Docs](https://www.datacamp.com/doc)[Open Source](https://www.datacamp.com/open-source)[RDocumentation](https://www.rdocumentation.org/)[Book a Demo with DataCamp for Business](https://www.datacamp.com/business/demo)[Data Portfolio](https://www.datacamp.com/data-portfolio)
**Plans**
[Pricing](https://www.datacamp.com/pricing)[For Students](https://www.datacamp.com/pricing/student)[For Business](https://www.datacamp.com/business)[For Universities](https://www.datacamp.com/universities)[Discounts, Promos & Sales](https://www.datacamp.com/promo)[Expense DataCamp](https://www.datacamp.com/expense)[DataCamp Donates](https://www.datacamp.com/donates)
**For Business**
[Business Pricing](https://www.datacamp.com/business/compare-plans)[Teams Plan](https://www.datacamp.com/business/learn-teams)[Data & AI Unlimited Plan](https://www.datacamp.com/business/data-unlimited)[Customer Stories](https://www.datacamp.com/business/customer-stories)[Partner Program](https://www.datacamp.com/business/partner-program)
**About**
[About Us](https://www.datacamp.com/about)[Learner Stories](https://www.datacamp.com/stories)[Careers](https://www.datacamp.com/careers)[Become an Instructor](https://www.datacamp.com/learn/create)[Press](https://www.datacamp.com/press)[Leadership](https://www.datacamp.com/about/leadership)[Contact Us](https://support.datacamp.com/hc/en-us/articles/360021185634)[DataCamp Español](https://www.datacamp.com/es)[DataCamp Português](https://www.datacamp.com/pt)[DataCamp Deutsch](https://www.datacamp.com/de)[DataCamp Français](https://www.datacamp.com/fr)
**Support**
[Help Center](https://support.datacamp.com/hc/en-us)[Become an Affiliate](https://www.datacamp.com/affiliates)
[Facebook](https://www.facebook.com/datacampinc/)
[Twitter](https://twitter.com/datacamp)
[LinkedIn](https://www.linkedin.com/school/datacampinc/)
[YouTube](https://www.youtube.com/channel/UC79Gv3mYp6zKiSwYemEik9A)
[Instagram](https://www.instagram.com/datacamp/)
[Privacy Policy](https://www.datacamp.com/privacy-policy)[Cookie Notice](https://www.datacamp.com/cookie-notice)[Do Not Sell My Personal Information](https://www.datacamp.com/do-not-sell-my-personal-information)[Accessibility](https://www.datacamp.com/accessibility)[Security](https://www.datacamp.com/security)[Terms of Use](https://www.datacamp.com/terms-of-use)
© 2026 DataCamp, Inc. All Rights Reserved. | |||||||||
| Readable Markdown | 1. [Home](https://www.datacamp.com/)
2. [Tutorials](https://www.datacamp.com/tutorial)
3. [Data Science](https://www.datacamp.com/tutorial/category/data-science)
The central limit theorem states that, with a sufficiently large sample size, the sampling distribution of the mean will be normally distributed, regardless of the population’s distribution. Learn its formula, key conditions, and applications in statistics and machine learning.
Apr 2, 2025 · 8 min read
***
Author
Laiba Siddiqui
Topics
Learn with DataCamp
Course
### [Foundations of Probability in R](https://www.datacamp.com/courses/foundations-of-probability-in-r)
4 hr
41\.8K
In this course, you'll learn about the concepts of random variables, distributions, and conditioning.
Course
### [Foundations of Probability in Python](https://www.datacamp.com/courses/foundations-of-probability-in-python)
5 hr
15\.5K
Learn fundamental probability concepts like random variables, mean and variance, probability distributions, and conditional probabilities.
Course
### [Sampling in Python](https://www.datacamp.com/courses/sampling-in-python)
4 hr
52\.4K
Learn to draw conclusions from limited data using Python and statistics. This course covers everything from random sampling to stratified and cluster sampling.
[See More](https://www.datacamp.com/category/probability-and-statistics) | |||||||||
| ML Classification | ||||||||||
| ML Categories |
Raw JSON{
"/Science": 919,
"/Science/Mathematics": 896,
"/Science/Mathematics/Statistics": 889
} | |||||||||
| ML Page Types |
Raw JSON{
"/Article": 995,
"/Article/Tutorial_or_Guide": 577
} | |||||||||
| ML Intent Types |
Raw JSON{
"Informational": 999
} | |||||||||
| Content Metadata | ||||||||||
| Language | en | |||||||||
| Author | Laiba Siddiqui | |||||||||
| Publish Time | not set | |||||||||
| Original Publish Time | 2025-04-02 21:43:10 (1 year ago) | |||||||||
| Republished | No | |||||||||
| Word Count (Total) | 2,722 | |||||||||
| Word Count (Content) | 138 | |||||||||
| Links | ||||||||||
| External Links | 11 | |||||||||
| Internal Links | 181 | |||||||||
| Technical SEO | ||||||||||
| Meta Nofollow | No | |||||||||
| Meta Noarchive | No | |||||||||
| JS Rendered | Yes | |||||||||
| Redirect Target | null | |||||||||
| Performance | ||||||||||
| Download Time (ms) | 81 | |||||||||
| TTFB (ms) | 72 | |||||||||
| Download Size (bytes) | 75,891 | |||||||||
| Shard | 136 (laksa) | |||||||||
| Root Hash | 7979813049800185936 | |||||||||
| Unparsed URL | com,datacamp!www,/tutorial/central-limit-theorem s443 | |||||||||