ℹ️ Skipped - page is already crawled
| Filter | Status | Condition | Details |
|---|---|---|---|
| HTTP status | PASS | download_http_code = 200 | HTTP 200 |
| Age cutoff | PASS | download_stamp > now() - 6 MONTH | 0.2 months ago |
| History drop | PASS | isNull(history_drop_reason) | No drop reason |
| Spam/ban | PASS | fh_dont_index != 1 AND ml_spam_score = 0 | ml_spam_score=0 |
| Canonical | PASS | meta_canonical IS NULL OR = '' OR = src_unparsed | Not set |
| Property | Value |
|---|---|
| URL | https://optionalpha.com/learn/bollinger-bands |
| Last Crawled | 2026-04-01 22:40:29 (6 days ago) |
| First Indexed | 2023-05-15 23:50:43 (2 years ago) |
| HTTP Status Code | 200 |
| Meta Title | Bollinger Bands: What They Are & How to Use Them |
| Meta Description | Bollinger bands are a volatility technical indicator that show the upper and lower range of normal price movement using standard deviation. |
| Meta Canonical | null |
| Boilerpipe Text | Bollinger Bands are a volatility indicator created by
John Bollinger
. Bollinger Bands consist of a
simple moving average (SMA)
and two bands above and below the SMA. Typically, the centerline is a 20-day moving average and the bands are two
standard deviations
.
The bands are dynamic and display changes in volatility. They widen when price volatility is increasing and contract when volatility decreases, allowing traders to quickly identify periods of high and low volatility.
Bollinger Bands provide a relative definition of high and low prices for a given ticker symbol. By definition, prices are considered high at the upper band and low at the lower band. Traders can use this information to determine whether prices are relatively high or low in comparison to past price action.
If the bands are drawn two standard deviations above and below the center simple moving average, approximately 95% of the security’s price action should occur within the bands.
Price moving above the upper band or below the lower band is often used as trading signal. Price tends to oscillate within the bands, so the upper and lower bands can be used as resistance and support or as a breakout signal.
When combined with other
technical indicators
, such as
MACD
and
RSI
, Bollinger Bands can help identify overbought/oversold conditions, trend reversals, continuation, and more.
Bollinger bands are used to measure volatility and define potential price channels or
trends
. When prices move outside the bands, it can indicate that a new trend is beginning or that prices have become overextended.
There are many Bollinger Bands strategies and traders use the indicator several ways.
Mean reversion
traders may buy the security when its price touches the lower band and sell when price hits the upper band. Conversely,
momentum traders
could use the bands as a signal that price will continue and buy near the upper band or sell near the lower band.
Calculating Bollinger Bands
Bollinger Bands consist of three lines. The middle line is a simple moving average (SMA) and the upper and lower lines are ‘n’ standard deviations above and below the SMA, respectively. Calculating Bollinger Bands is fairly straightforward:
Calculate a simple moving average of the asset’s price over a specific time period.
Calculate standard deviation over the same time period.
Draw lines 'n' standard deviation above and below the SMA to get the upper and lower bands.
FAQs
What are Bollinger Bands?
Bollinger Bands are a volatility indicator created by
John Bollinger
. Bollinger Bands consist of a
simple moving average (SMA)
and two bands above and below the SMA. Typically, the centerline is a 20-day moving average and the bands are two
standard deviations
.
How to read Bollinger Bands?
The main purpose of Bollinger Bands is to provide traders with a relative definition of high and low prices for a given market. By definition, prices are high at the upper band and low at the lower band. This information can be used to determine whether prices are relatively high or low in comparison to past price action.
Price tends to oscillate within the bands and the upper and lower bands can be used as resistance and support. Breakouts above the upper band or below the lower band are often used as trading signals.
How do you use Bollinger bands?
Bollinger bands are used to measure price volatility. When the bands widen, price volatility is increasing and when the bands contract, volatility is decreasing.
You can use Bollinger Bands to identify price action that is overextended.
Mean reversion
and
trend following
traders use Bollinger Bands to go long or short a security based on their interpretation of the trading signal.
How Accurate are Bollinger Bands?
Bollinger Bands are a reliable and effective tool for measuring market volatility. They provide traders with an objective measure of whether prices are high or low on a relative basis.
Bollinger Bands are a lagging indicator but they're a popular tool due to their simplicity and effectiveness in gauging market volatility. Traders can combine them with other
technical indicators
to predict future price movements. |
| Markdown | Get Option Alpha **100% FREE** by connecting your TradeStation or Tradier brokerage account! [Learn more](https://optionalpha.com/pricing).
📣 75% OFF Early Bird Sale\!
Special Easter Pricing this week only 👉 [Learn more](https://optionalpha.com/new-year).
📣 72% OFF Sale\!
Ends tonight at midnight! 👉 [Learn more](https://optionalpha.com/new-year).
[](https://optionalpha.com/)
[Home](https://optionalpha.com/)
[Resources](https://optionalpha.com/resources)
[Bots 101](https://optionalpha.com/bots-101)[Integrations](https://optionalpha.com/integrations)
[Education](https://optionalpha.com/education)
[Courses](https://optionalpha.com/courses)[Strategies](https://optionalpha.com/options-strategies)[Handbook](https://optionalpha.com/handbook)[Podcast](https://optionalpha.com/podcast)[Blog](https://optionalpha.com/blog)
[Pricing](https://optionalpha.com/pricing)[Brokers](https://optionalpha.com/integrations)[FAQ](https://optionalpha.com/faqs)
[Cyber Monday](https://optionalpha.com/black-friday)
[SAVE 72%](https://optionalpha.com/black-friday)
[Start Free Trial](https://optionalpha.com/start)[Login](https://app.optionalpha.com/login)
[](https://optionalpha.com/learn/bollinger-bands)
[Login](https://app.optionalpha.com/login)[Start Free Trial](https://optionalpha.com/start)

[Home](https://optionalpha.com/)
[Education](https://optionalpha.com/education)
[Handbook](https://optionalpha.com/handbook)
[Technical Indicators](https://optionalpha.com/topics/technical-indicators)
[Bollinger Bands](https://optionalpha.com/learn/bollinger-bands)
# Bollinger Bands
Bollinger bands are a volatility technical indicator that show the upper and lower range of normal price movement using standard deviation.
[View risk disclosures](https://optionalpha.com/legal/risk-disclosure-agreement)
[optionalpha.com/learn/bollinger-bands](https://optionalpha.com/learn/bollinger-bands)
Bollinger Bands are a volatility indicator created by [John Bollinger](https://www.bollingerbands.com/). Bollinger Bands consist of a [simple moving average (SMA)](https://optionalpha.com/learn/simple-moving-average) and two bands above and below the SMA. Typically, the centerline is a 20-day moving average and the bands are two [standard deviations](https://optionalpha.com/topics/financial-modeling).
The bands are dynamic and display changes in volatility. They widen when price volatility is increasing and contract when volatility decreases, allowing traders to quickly identify periods of high and low volatility.
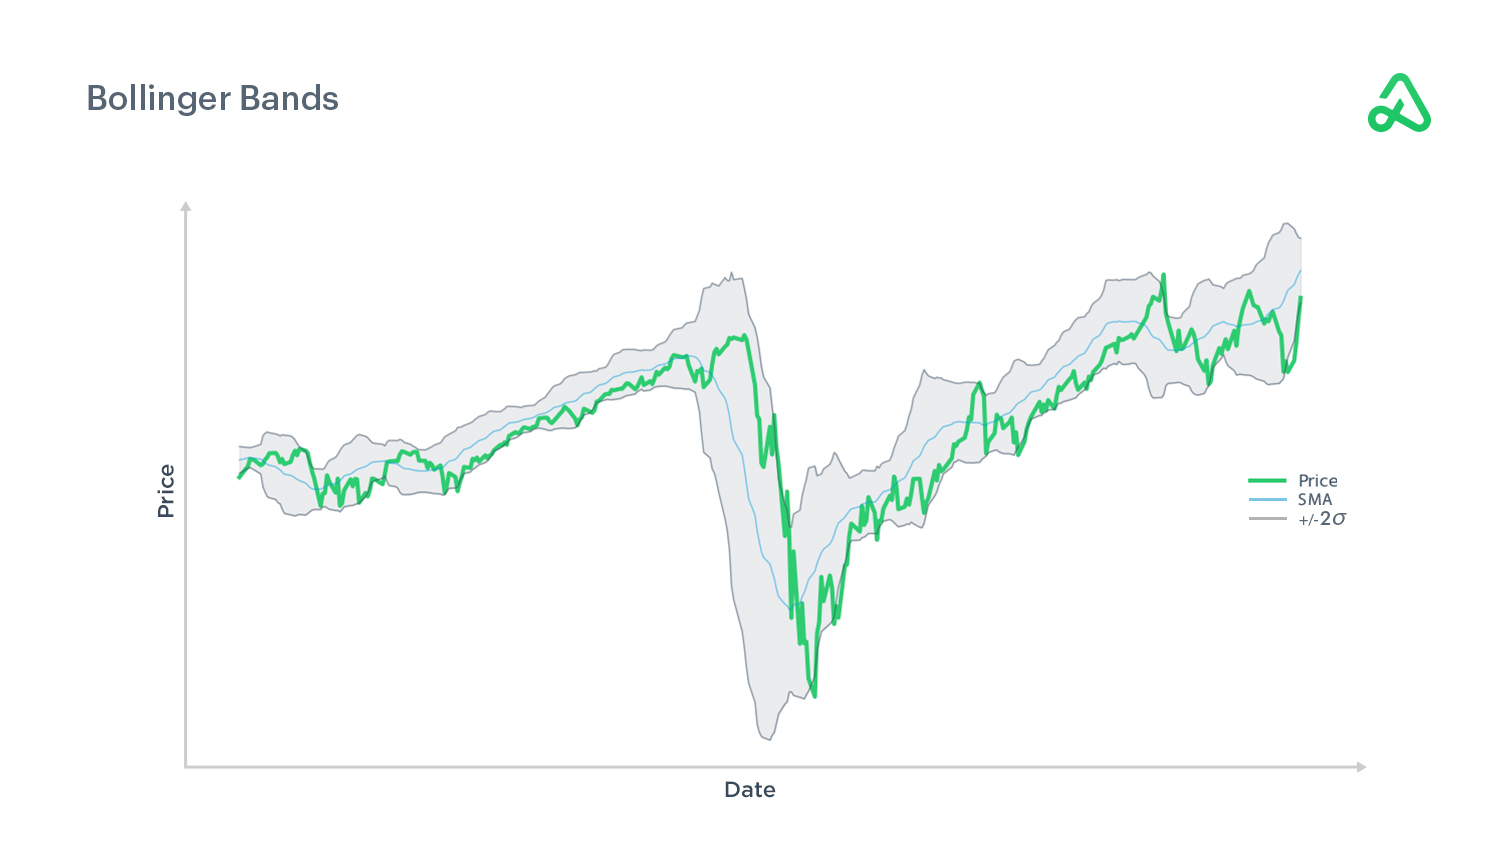
Bollinger Bands provide a relative definition of high and low prices for a given ticker symbol. By definition, prices are considered high at the upper band and low at the lower band. Traders can use this information to determine whether prices are relatively high or low in comparison to past price action.
If the bands are drawn two standard deviations above and below the center simple moving average, approximately 95% of the security’s price action should occur within the bands.

Price moving above the upper band or below the lower band is often used as trading signal. Price tends to oscillate within the bands, so the upper and lower bands can be used as resistance and support or as a breakout signal.
When combined with other [technical indicators](https://optionalpha.com/topics/technical-indicators), such as [MACD](https://optionalpha.com/learn/macd-indicator) and [RSI](https://optionalpha.com/learn/rsi-indicator), Bollinger Bands can help identify overbought/oversold conditions, trend reversals, continuation, and more.
## **How to Use Bollinger Bands**
Bollinger bands are used to measure volatility and define potential price channels or [trends](https://optionalpha.com/topics/trend-trading). When prices move outside the bands, it can indicate that a new trend is beginning or that prices have become overextended.
There are many Bollinger Bands strategies and traders use the indicator several ways. [Mean reversion](https://optionalpha.com/learn/mean-reversion) traders may buy the security when its price touches the lower band and sell when price hits the upper band. Conversely, [momentum traders](https://optionalpha.com/topics/momentum-trading) could use the bands as a signal that price will continue and buy near the upper band or sell near the lower band.
## **Calculating Bollinger Bands**
Bollinger Bands consist of three lines. The middle line is a simple moving average (SMA) and the upper and lower lines are ‘n’ standard deviations above and below the SMA, respectively. Calculating Bollinger Bands is fairly straightforward:
- Calculate a simple moving average of the asset’s price over a specific time period.
- Calculate standard deviation over the same time period.
- Draw lines 'n' standard deviation above and below the SMA to get the upper and lower bands.
## FAQs
### What are Bollinger Bands?
Bollinger Bands are a volatility indicator created by [John Bollinger](https://www.bollingerbands.com/). Bollinger Bands consist of a [simple moving average (SMA)](https://optionalpha.com/learn/simple-moving-average) and two bands above and below the SMA. Typically, the centerline is a 20-day moving average and the bands are two [standard deviations](https://optionalpha.com/topics/financial-modeling).
### How to read Bollinger Bands?
The main purpose of Bollinger Bands is to provide traders with a relative definition of high and low prices for a given market. By definition, prices are high at the upper band and low at the lower band. This information can be used to determine whether prices are relatively high or low in comparison to past price action.
Price tends to oscillate within the bands and the upper and lower bands can be used as resistance and support. Breakouts above the upper band or below the lower band are often used as trading signals.
### How do you use Bollinger bands?
Bollinger bands are used to measure price volatility. When the bands widen, price volatility is increasing and when the bands contract, volatility is decreasing.
You can use Bollinger Bands to identify price action that is overextended. [Mean reversion](https://optionalpha.com/learn/mean-reversion) and [trend following](https://optionalpha.com/topics/trend-trading) traders use Bollinger Bands to go long or short a security based on their interpretation of the trading signal.
### How Accurate are Bollinger Bands?
Bollinger Bands are a reliable and effective tool for measuring market volatility. They provide traders with an objective measure of whether prices are high or low on a relative basis.
Bollinger Bands are a lagging indicator but they're a popular tool due to their simplicity and effectiveness in gauging market volatility. Traders can combine them with other [technical indicators](https://optionalpha.com/topics/technical-indicators) to predict future price movements.
Contributors
[Steve Henry Content Director](https://optionalpha.com/team/steve-henry)
[.png)Kirk Du Plessis Founder](https://optionalpha.com/team/kirk-duplessis)
Last updated:
May 15, 2023
Sep 13, 2023
Originally published:
May 15, 2023
[Technical Indicators](https://optionalpha.com/tags/technical-indicators)
[Technical Analysis](https://optionalpha.com/tags/technical-analysis)
[SMA](https://optionalpha.com/tags/sma)
[Volatility](https://optionalpha.com/tags/volatility)
Highlights
- Bollinger Bands measure a security's price volatility.
- Bollinger Bands use a simple moving average and standard deviation.
- Traders use Bollinger Bands as a trend following or mean reversion trading signal.
On this page
[Example H2](https://optionalpha.com/learn/bollinger-bands)
[Example H3](https://optionalpha.com/learn/bollinger-bands)
[Example H4](https://optionalpha.com/learn/bollinger-bands)
[FAQs](https://optionalpha.com/learn/bollinger-bands)
Popular...
[GuidesAutotrading Quick-StartThis 4-part guide shows you how to safely get started with automated trading by the end of the day.](https://optionalpha.com/learn/bollinger-bands)
[Watch Now](https://optionalpha.com/learn/bollinger-bands)

Trade with conviction
Find an edge backtesting 0DTE and next day strategies using 1 minute data then leverage automation to execute your strategy better than humanly possible.
[Start My Free Trial](https://optionalpha.com/start)
## You might also like
Our philosophy is simple — publish options education that's better than everyone else. No ads, no fluff, no subjective bias; just the facts beautifully organized for you.
[ Learn how to automate a Bollinger Band strategy This blog shows you how to build a bot using debit and credit spreads to trade breakouts.Read more](https://optionalpha.com/blog/how-to-automate-a-bollinger-band-strategy)
[ Here's your complete guide to trading option spreads This page has everything you need to know about short put spreads and short call spreadsRead more](https://optionalpha.com/learn/vertical-spread)
###### Trade with discipline and consistency
**Find opportunities. Backtest ideas. Automate strategies.**
[Learn more](https://optionalpha.com/backtester-start)
[Start Free Trial](https://optionalpha.com/start)

[](https://optionalpha.com/)
- [](https://www.facebook.com/OptionAlphaCompany)
- [](https://www.instagram.com/optionalpha/)
- [](https://www.youtube.com/OptionAlpha?sub_confirmation=1)
- [](https://www.linkedin.com/company/optionalpha)
- [](https://twitter.com/OptionAlpha)
###### Platform
- [Bots](https://optionalpha.com/bots)
- [Templates](https://optionalpha.com/templates)
- [Integrations](https://optionalpha.com/integrations)
- [Backtester](https://optionalpha.com/backtester)
- [Community](https://optionalpha.com/community)
###### Resources
- [Bots 101](https://optionalpha.com/bots-101)
- [Workshops](https://app.livestorm.co/optionalpha)
- [Videos](https://optionalpha.com/videos)
###### Education
- [Courses](https://optionalpha.com/courses)
- [Strategies](https://optionalpha.com/options-strategies)
- [Handbook](https://optionalpha.com/handbook)
- [Podcast](https://optionalpha.com/podcast)
- [Blog](https://optionalpha.com/blog)
###### Company
- [About](https://optionalpha.com/about-us)
- [Careers](https://optionalpha.com/careers)
- [Team](https://optionalpha.com/team)
- [Legal](https://optionalpha.com/legal)
- [Help](https://docs.optionalpha.com/)
- [Contact](https://optionalpha.com/contact)
- [Status](https://status.optionalpha.com/)
© 2026 Option Alpha. All Rights Reserved. Patent Pending USSN 63/118,547
['%3e%3cg id='Final-Copy-2_2_' transform='translate(1275.000000, 200.000000)'%3e%3cpath class='st0' d='M7.4,12.8h6.8l3.1-11.6H7.4C4.2,1.2,1.6,3.8,1.6,7S4.2,12.8,7.4,12.8z'/%3e%3c/g%3e%3c/g%3e%3c/g%3e%3cg id='final---dec.11-2020'%3e%3cg id='_x30_208-our-toggle' transform='translate(-1275.000000, -200.000000)'%3e%3cg id='Final-Copy-2' transform='translate(1275.000000, 200.000000)'%3e%3cpath class='st1' d='M22.6,0H7.4c-3.9,0-7,3.1-7,7s3.1,7,7,7h15.2c3.9,0,7-3.1,7-7S26.4,0,22.6,0z M1.6,7c0-3.2,2.6-5.8,5.8-5.8 h9.9l-3.1,11.6H7.4C4.2,12.8,1.6,10.2,1.6,7z'/%3e%3cpath id='x' class='st2' d='M24.6,4c0.2,0.2,0.2,0.6,0,0.8l0,0L22.5,7l2.2,2.2c0.2,0.2,0.2,0.6,0,0.8c-0.2,0.2-0.6,0.2-0.8,0 l0,0l-2.2-2.2L19.5,10c-0.2,0.2-0.6,0.2-0.8,0c-0.2-0.2-0.2-0.6,0-0.8l0,0L20.8,7l-2.2-2.2c-0.2-0.2-0.2-0.6,0-0.8 c0.2-0.2,0.6-0.2,0.8,0l0,0l2.2,2.2L23.8,4C24,3.8,24.4,3.8,24.6,4z'/%3e%3cpath id='y' class='st3' d='M12.7,4.1c0.2,0.2,0.3,0.6,0.1,0.8l0,0L8.6,9.8C8.5,9.9,8.4,10,8.3,10c-0.2,0.1-0.5,0.1-0.7-0.1l0,0 L5.4,7.7c-0.2-0.2-0.2-0.6,0-0.8c0.2-0.2,0.6-0.2,0.8,0l0,0L8,8.6l3.8-4.5C12,3.9,12.4,3.9,12.7,4.1z'/%3e%3c/g%3e%3c/g%3e%3c/g%3e%3c/g%3e%3c/svg%3e>) Your Privacy Choices](https://optionalpha.com/learn/bollinger-bands)
[Notice at Collection](https://optionalpha.com/learn/bollinger-bands) |
| Readable Markdown | Bollinger Bands are a volatility indicator created by [John Bollinger](https://www.bollingerbands.com/). Bollinger Bands consist of a [simple moving average (SMA)](https://optionalpha.com/learn/simple-moving-average) and two bands above and below the SMA. Typically, the centerline is a 20-day moving average and the bands are two [standard deviations](https://optionalpha.com/topics/financial-modeling).
The bands are dynamic and display changes in volatility. They widen when price volatility is increasing and contract when volatility decreases, allowing traders to quickly identify periods of high and low volatility.

Bollinger Bands provide a relative definition of high and low prices for a given ticker symbol. By definition, prices are considered high at the upper band and low at the lower band. Traders can use this information to determine whether prices are relatively high or low in comparison to past price action.
If the bands are drawn two standard deviations above and below the center simple moving average, approximately 95% of the security’s price action should occur within the bands.

Price moving above the upper band or below the lower band is often used as trading signal. Price tends to oscillate within the bands, so the upper and lower bands can be used as resistance and support or as a breakout signal.
When combined with other [technical indicators](https://optionalpha.com/topics/technical-indicators), such as [MACD](https://optionalpha.com/learn/macd-indicator) and [RSI](https://optionalpha.com/learn/rsi-indicator), Bollinger Bands can help identify overbought/oversold conditions, trend reversals, continuation, and more.
Bollinger bands are used to measure volatility and define potential price channels or [trends](https://optionalpha.com/topics/trend-trading). When prices move outside the bands, it can indicate that a new trend is beginning or that prices have become overextended.
There are many Bollinger Bands strategies and traders use the indicator several ways. [Mean reversion](https://optionalpha.com/learn/mean-reversion) traders may buy the security when its price touches the lower band and sell when price hits the upper band. Conversely, [momentum traders](https://optionalpha.com/topics/momentum-trading) could use the bands as a signal that price will continue and buy near the upper band or sell near the lower band.
## **Calculating Bollinger Bands**
Bollinger Bands consist of three lines. The middle line is a simple moving average (SMA) and the upper and lower lines are ‘n’ standard deviations above and below the SMA, respectively. Calculating Bollinger Bands is fairly straightforward:
- Calculate a simple moving average of the asset’s price over a specific time period.
- Calculate standard deviation over the same time period.
- Draw lines 'n' standard deviation above and below the SMA to get the upper and lower bands.
FAQs
### What are Bollinger Bands?
Bollinger Bands are a volatility indicator created by [John Bollinger](https://www.bollingerbands.com/). Bollinger Bands consist of a [simple moving average (SMA)](https://optionalpha.com/learn/simple-moving-average) and two bands above and below the SMA. Typically, the centerline is a 20-day moving average and the bands are two [standard deviations](https://optionalpha.com/topics/financial-modeling).
### How to read Bollinger Bands?
The main purpose of Bollinger Bands is to provide traders with a relative definition of high and low prices for a given market. By definition, prices are high at the upper band and low at the lower band. This information can be used to determine whether prices are relatively high or low in comparison to past price action.
Price tends to oscillate within the bands and the upper and lower bands can be used as resistance and support. Breakouts above the upper band or below the lower band are often used as trading signals.
### How do you use Bollinger bands?
Bollinger bands are used to measure price volatility. When the bands widen, price volatility is increasing and when the bands contract, volatility is decreasing.
You can use Bollinger Bands to identify price action that is overextended. [Mean reversion](https://optionalpha.com/learn/mean-reversion) and [trend following](https://optionalpha.com/topics/trend-trading) traders use Bollinger Bands to go long or short a security based on their interpretation of the trading signal.
### How Accurate are Bollinger Bands?
Bollinger Bands are a reliable and effective tool for measuring market volatility. They provide traders with an objective measure of whether prices are high or low on a relative basis.
Bollinger Bands are a lagging indicator but they're a popular tool due to their simplicity and effectiveness in gauging market volatility. Traders can combine them with other [technical indicators](https://optionalpha.com/topics/technical-indicators) to predict future price movements. |
| Shard | 72 (laksa) |
| Root Hash | 6261014955454694472 |
| Unparsed URL | com,optionalpha!/learn/bollinger-bands s443 |