ℹ️ Skipped - page is already crawled
| Filter | Status | Condition | Details |
|---|---|---|---|
| HTTP status | PASS | download_http_code = 200 | HTTP 200 |
| Age cutoff | PASS | download_stamp > now() - 6 MONTH | 0.1 months ago |
| History drop | PASS | isNull(history_drop_reason) | No drop reason |
| Spam/ban | PASS | fh_dont_index != 1 AND ml_spam_score = 0 | ml_spam_score=0 |
| Canonical | PASS | meta_canonical IS NULL OR = '' OR = src_unparsed | Not set |
| Property | Value |
|---|---|
| URL | https://lightningchart.com/blog/trader/bollinger-bands-explained/ |
| Last Crawled | 2026-04-07 18:04:07 (3 days ago) |
| First Indexed | 2024-10-13 21:54:07 (1 year ago) |
| HTTP Status Code | 200 |
| Meta Title | Bollinger Bands Explained: Guide & Technical Implementation |
| Meta Description | Bollinger Bands explained: a guide and technical implementation with LightningChart JS Trader. |
| Meta Canonical | null |
| Boilerpipe Text | Bollinger Bands were introduced by John Bollinger, a financial analyst and trader, in the early 1980s. Prior to Bollinger’s innovation, technical analysts often used fixed-width bands to track price movements, but these did not adapt to changing market conditions. Bollinger realized that market volatility was dynamic, and fixed bands were often inadequate for capturing real-time market shifts.
By incorporating standard deviation into his bands, Bollinger was able to create a system that automatically adjusted to the volatility of the underlying asset. This made Bollinger Bands highly effective in various markets, including stocks, forex, commodities, and, more recently, cryptocurrencies.
Application in Financial Markets
Bollinger Bands can be applied to various asset classes, including:
Stocks:
Traders often use Bollinger Bands to identify periods of consolidation before a breakout or to spot overbought/oversold conditions.
Forex:
In the highly liquid forex market, Bollinger Bands help traders identify price squeezes or reversals, which are common in currency pairs.
Cryptocurrency:
Due to the high volatility of cryptocurrencies, Bollinger Bands are particularly useful in spotting extreme price movements, such as the sharp price increases or drops often seen in assets like Bitcoin or Ethereum.
Why Bollinger Bands are Effective?
One of the core reasons why Bollinger Bands are so widely adopted is their ability to dynamically adapt to changing market conditions. Many traditional technical indicators, like the Relative Strength Index (RSI) or Moving Average Convergence Divergence (MACD), operate within predefined ranges. However, Bollinger Bands adjust to volatility in real-time, making them effective in both trending and ranging markets.
Trend Identification
Bollinger Bands help traders assess the strength of a trend. For example:
In an uptrend, the price tends to hug the upper band. This suggests strong bullish momentum.
In a downtrend, the price may consistently test the lower band, indicating persistent bearish pressure.
Volatility Breakouts
Bollinger Bands are often used to predict volatility breakouts, which occur when the price moves aggressively out of a narrow range. The contraction of the bands (known as the Bollinger Band Squeeze) signals a period of low volatility, often preceding a breakout. When the bands expand, traders anticipate increased volatility, and the price may move significantly in one direction.
Overbought/Oversold Signals
When prices move above the upper band, it is often interpreted as a signal that the market is overbought, meaning a correction could be imminent. Conversely, when prices move below the lower band, the market may be oversold, offering potential buying opportunities.
How Traders Use Bollinger Bands in Conjunction with Other Indicators?
To increase the accuracy of trading signals, Bollinger Bands are often combined with other indicators such as the Relative Strength Index (RSI) or the MACD:
RSI:
Bollinger Bands combined with the RSI can help confirm whether an asset is genuinely overbought or oversold. For instance, if the price touches the upper band while the RSI is above 70, this reinforces the overbought signal.
MACD:
Traders might look for divergence between price movement and the MACD, using the Bollinger Bands to spot potential breakouts or reversals. |
| Markdown | ×
### Quotation for LightningChart JS
×

# Try LightningChart JS FREE for 30 days
## We’ll send you a download link (.zip) directly to your inbox.
#### During your 30-day trial, you'll get:
- Full technical support and onboarding assistance
- 100+ ready-made interactive examples
- Documentation tailored for your industry and needs
- All the product features
#### We'd love to show you how LightningChart can be customized to suit your needs.

#### Dhawal Kapoor
Senior Sales Associate (Europe, India)
**\+91 85917 31582**
[Book a meeting](https://meetings.hubspot.com/dhawal-kapoor/online-meeting-europe)

#### Yun Du
Regional Account & Marketing Executive (China, Japan and South Korea)
**\+358 503 543 706**
[Book a meeting](https://meetings.hubspot.com/yun-du/east-asia)

#### Robert Taylor
Regional Account Manager (North America, South America)
**\+358 505 528 995**
[Book a meeting](https://meetings.hubspot.com/robert-taylor8/online-meeting-americas)
Our dedicated sales team is ready to help you find the perfect solution for your data visualization needs. Don't hesitate to reach out for personalized assistance or to schedule a demo of our products.
×

# Try LightningChart .NET FREE for 30 days
## We’ll send you a download link directly to your inbox.
#### During your 30-day trial, you'll get:
- Full technical support and onboarding assistance
- 100+ ready-made interactive examples
- Documentation tailored for your industry and needs
- All the product features
#### We'd love to show you how LightningChart can be customized to suit your needs.

#### Dhawal Kapoor
Senior Sales Associate (Europe, India)
**\+91 85917 31582**
[Book a meeting](https://meetings.hubspot.com/dhawal-kapoor/online-meeting-europe)

#### Yun Du
Regional Account & Marketing Executive (China, Japan and South Korea)
**\+358 503 543 706**
[Book a meeting](https://meetings.hubspot.com/yun-du/east-asia)

#### Robert Taylor
Regional Account Manager (North America, South America)
**\+358 505 528 995**
[Book a meeting](https://meetings.hubspot.com/robert-taylor8/online-meeting-americas)
Our dedicated sales team is ready to help you find the perfect solution for your data visualization needs. Don't hesitate to reach out for personalized assistance or to schedule a demo of our products.
×

# Apply for Student License
## Fill out the form below to get your free student license
- [Get Started](https://lightningchart.com/blog/trader/bollinger-bands-explained/)
- [LightningChart®JS Trial](https://lightningchart.com/js-charts/free-trial/)
- [LightningChart®.Net Trial](https://portal.lightningchart.com/loadform?view_name=free_or_trial_version_form&product_id=35&_gl=1*p6fqsd*_gcl_au*OTI2MjgxOTYuMTc0NDcxMzY3MA..)
- [LightningChart®Python Trial](https://lightningchart.com/python-charts/?_gl=1*1xsh2w7*_gcl_au*OTI2MjgxOTYuMTc0NDcxMzY3MA..)
- [LightningChart®JS Fintech Trial](https://lightningchart.com/js-charts/trader/)
- [Sign In](https://portal.lightningchart.com/user/login)
[](https://lightningchart.com/)
[](https://lightningchart.com/)
- [GET STARTED](https://lightningchart.com/blog/trader/bollinger-bands-explained/)
- [Dashtera Dashboards](https://dashtera.com/)
- [LightningChart JS](https://lightningchart.com/js-charts/)
- [LightningChart JS Trader](https://lightningchart.com/js-charts/trader/)
- [LightningChart .NET](https://lightningchart.com/net-charts/)
- [LightningChart Python](https://lightningchart.com/python-charts/)
- [LightningChart Python Trader](https://lightningchart.com/python-charts/trader/)
- [SIGN IN](https://portal.lightningchart.com/user/login)
- [Products](https://lightningchart.com/blog/trader/bollinger-bands-explained/)
- [DASHTERA Dashboards](https://dashtera.com/)
- [JS Charts](https://lightningchart.com/blog/trader/bollinger-bands-explained/)
- [For web, Desktop & Mobile](https://lightningchart.com/js-charts/)
- [Interactive Examples](https://lightningchart.com/js-charts/interactive-examples/)
- [About Performance](https://lightningchart.com/js-charts/performance/)
- [Free 30-Day Trial](https://lightningchart.com/js-charts/free-trial/)
- [Get Started](https://lightningchart.com/js-charts/docs/)
- [DataGrid](https://lightningchart.com/js-charts/datagrid/)
- [Roadmap](https://lightningchart.com/roadmap/?tab=2)
- [.NET Charts](https://lightningchart.com/blog/trader/bollinger-bands-explained/)
- [For Desktop](https://lightningchart.com/net-charts/)
- [Gallery](https://lightningchart.com/net-charts/gallery/)
- [About Performance](https://lightningchart.com/net-charts/performance/)
- [Free 30-Day Trial](https://portal.lightningchart.com/net-charts/)
- [Get Started](https://lightningchart.com/net-charts/docs/category/getting-started/)
- [Resources](https://lightningchart.com/net-charts/resources/)
- [Roadmap](https://lightningchart.com/roadmap/?tab=Net)
- [Python Charts]()
- [Data Scientists & Developers](https://lightningchart.com/python-charts/)
- [Gallery](https://lightningchart.com/python-charts/docs/features/)
- [About Performance](https://lightningchart.com/python-charts/performance/)
- [Get Started](https://lightningchart.com/python-charts/docs/)
- [Roadmap](https://lightningchart.com/roadmap/?tab=4)
- [JS Trading Charts]()
- [Fintech Charts](https://lightningchart.com/js-charts/trader/)
- [Interactive Examples](https://lightningchart.com/js-charts/trader/interactive-examples/)
- [Get Started](https://lightningchart.com/js-charts/trader/docs/)
- [Roadmap](https://lightningchart.com/roadmap/?tab=3)
- [Python Trading Charts](https://lightningchart.com/blog/trader/bollinger-bands-explained/)
- [Fintech Charts](https://lightningchart.com/python-charts/trader/)
- [Gallery](https://lightningchart.com/python-charts/trader/docs/examples/)
- [Get Started](https://lightningchart.com/python-charts/trader/docs/)
- [Roadmap](https://lightningchart.com/roadmap/?tab=5)
- [Gauge Controls](https://lightningchart.com/gauges/)
- [Turnkey Services](https://lightningchart.com/data-visualization-services/)
- [Development Work Kits](https://lightningchart.com/development-work-for-data-visualization-applications/)
- [Industries](https://lightningchart.com/blog/trader/bollinger-bands-explained/)
- [Case Studies](https://lightningchart.com/case-studies/)
- [Trading & Finance](https://lightningchart.com/trading-and-finance-charts/)
- [Medical Applications](https://lightningchart.com/medical-applications-charts/)
- [Industrial Automation](https://lightningchart.com/industrial-automation-charts/)
- [Vibration Analysis](https://lightningchart.com/vibration-analysis-charts/)
- [Aerospace and Defense](https://lightningchart.com/aerospace-and-defense-charts/)
- [Telecommunication](https://lightningchart.com/telecommunication-charts/)
- [Energy, Oil & Gas](https://lightningchart.com/energy-oil-and-gas-charts/)
- [Instrumentation](https://lightningchart.com/instrumentation-charts/)
- [Automotive Engineering](https://lightningchart.com/automotive-engineering-charts/)
- [Scientific Research](https://lightningchart.com/scientific-research-charts/)
- [Industrial Process Monitoring](https://lightningchart.com/industrial-process-monitoring-charts/)
- [Motorsports](https://lightningchart.com/motorsports-charts/)
- [Transportation and Logistics](https://lightningchart.com/transportation-and-logistics-charts/)
- [Pricing](https://lightningchart.com/blog/trader/bollinger-bands-explained/)
- [JS Charts](https://lightningchart.com/js-charts/pricing/)
- [.NET Charts](https://lightningchart.com/net-charts/pricing/)
- [Gauge Controls](https://lightningchart.com/gauges/)
- [Development Work Kits](https://lightningchart.com/development-work-for-data-visualization-applications/)
- [Team](https://lightningchart.com/blog/trader/bollinger-bands-explained/)
- [Our Story](https://lightningchart.com/our-story/)
- [Our Team](https://lightningchart.com/about-us/)
- [Tech Support](https://lightningchart.com/technical-support/)
- [Contact](https://lightningchart.com/contact/)
- [Careers](https://lightningchart.com/careers/)
- [Affiliates](https://lightningchart.com/affiliates/)
- [Testimonials](https://lightningchart.com/testimonials/)
- [Blog](https://lightningchart.com/blog/)
- [Contact Us](https://lightningchart.com/contact/)
Select Page
- [Products](https://lightningchart.com/blog/trader/bollinger-bands-explained/)
- [DASHTERA Dashboards](https://dashtera.com/)
- [JS Charts](https://lightningchart.com/blog/trader/bollinger-bands-explained/)
- [For web, Desktop & Mobile](https://lightningchart.com/js-charts/)
- [Interactive Examples](https://lightningchart.com/js-charts/interactive-examples/)
- [About Performance](https://lightningchart.com/js-charts/performance/)
- [Free 30-Day Trial](https://lightningchart.com/js-charts/free-trial/)
- [Get Started](https://lightningchart.com/js-charts/docs/)
- [DataGrid](https://lightningchart.com/js-charts/datagrid/)
- [Roadmap](https://lightningchart.com/roadmap/?tab=2)
- [.NET Charts](https://lightningchart.com/blog/trader/bollinger-bands-explained/)
- [For Desktop](https://lightningchart.com/net-charts/)
- [Gallery](https://lightningchart.com/net-charts/gallery/)
- [About Performance](https://lightningchart.com/net-charts/performance/)
- [Free 30-Day Trial](https://portal.lightningchart.com/net-charts/)
- [Get Started](https://lightningchart.com/net-charts/docs/category/getting-started/)
- [Resources](https://lightningchart.com/net-charts/resources/)
- [Roadmap](https://lightningchart.com/roadmap/?tab=Net)
- [Python Charts]()
- [Data Scientists & Developers](https://lightningchart.com/python-charts/)
- [Gallery](https://lightningchart.com/python-charts/docs/features/)
- [About Performance](https://lightningchart.com/python-charts/performance/)
- [Get Started](https://lightningchart.com/python-charts/docs/)
- [Roadmap](https://lightningchart.com/roadmap/?tab=4)
- [JS Trading Charts]()
- [Fintech Charts](https://lightningchart.com/js-charts/trader/)
- [Interactive Examples](https://lightningchart.com/js-charts/trader/interactive-examples/)
- [Get Started](https://lightningchart.com/js-charts/trader/docs/)
- [Roadmap](https://lightningchart.com/roadmap/?tab=3)
- [Python Trading Charts](https://lightningchart.com/blog/trader/bollinger-bands-explained/)
- [Fintech Charts](https://lightningchart.com/python-charts/trader/)
- [Gallery](https://lightningchart.com/python-charts/trader/docs/examples/)
- [Get Started](https://lightningchart.com/python-charts/trader/docs/)
- [Roadmap](https://lightningchart.com/roadmap/?tab=5)
- [Gauge Controls](https://lightningchart.com/gauges/)
- [Turnkey Services](https://lightningchart.com/data-visualization-services/)
- [Development Work Kits](https://lightningchart.com/development-work-for-data-visualization-applications/)
- [Industries](https://lightningchart.com/blog/trader/bollinger-bands-explained/)
- [Case Studies](https://lightningchart.com/case-studies/)
- [Trading & Finance](https://lightningchart.com/trading-and-finance-charts/)
- [Medical Applications](https://lightningchart.com/medical-applications-charts/)
- [Industrial Automation](https://lightningchart.com/industrial-automation-charts/)
- [Vibration Analysis](https://lightningchart.com/vibration-analysis-charts/)
- [Aerospace and Defense](https://lightningchart.com/aerospace-and-defense-charts/)
- [Telecommunication](https://lightningchart.com/telecommunication-charts/)
- [Energy, Oil & Gas](https://lightningchart.com/energy-oil-and-gas-charts/)
- [Instrumentation](https://lightningchart.com/instrumentation-charts/)
- [Automotive Engineering](https://lightningchart.com/automotive-engineering-charts/)
- [Scientific Research](https://lightningchart.com/scientific-research-charts/)
- [Industrial Process Monitoring](https://lightningchart.com/industrial-process-monitoring-charts/)
- [Motorsports](https://lightningchart.com/motorsports-charts/)
- [Transportation and Logistics](https://lightningchart.com/transportation-and-logistics-charts/)
- [Pricing](https://lightningchart.com/blog/trader/bollinger-bands-explained/)
- [JS Charts](https://lightningchart.com/js-charts/pricing/)
- [.NET Charts](https://lightningchart.com/net-charts/pricing/)
- [Gauge Controls](https://lightningchart.com/gauges/)
- [Development Work Kits](https://lightningchart.com/development-work-for-data-visualization-applications/)
- [Team](https://lightningchart.com/blog/trader/bollinger-bands-explained/)
- [Our Story](https://lightningchart.com/our-story/)
- [Our Team](https://lightningchart.com/about-us/)
- [Tech Support](https://lightningchart.com/technical-support/)
- [Contact](https://lightningchart.com/contact/)
- [Careers](https://lightningchart.com/careers/)
- [Affiliates](https://lightningchart.com/affiliates/)
- [Testimonials](https://lightningchart.com/testimonials/)
- [Blog](https://lightningchart.com/blog/)
- [Contact Us](https://lightningchart.com/contact/)
- [Get Started](https://lightningchart.com/blog/trader/bollinger-bands-explained/)
- [LightningChart®JS Trial](https://lightningchart.com/js-charts/free-trial/)
- [LightningChart®.Net Trial](https://portal.lightningchart.com/loadform?view_name=free_or_trial_version_form&product_id=35&_gl=1*p6fqsd*_gcl_au*OTI2MjgxOTYuMTc0NDcxMzY3MA..)
- [LightningChart®Python Trial](https://lightningchart.com/python-charts/?_gl=1*1xsh2w7*_gcl_au*OTI2MjgxOTYuMTc0NDcxMzY3MA..)
- [LightningChart®JS Fintech Trial](https://lightningchart.com/js-charts/trader/)
- [Sign In](https://portal.lightningchart.com/user/login)
# LightningChart JS TraderBollinger Bands Explained: a guide + technical implementation
ArticleReviewing Bollinger Bands and their technical implementation using LightningChart JS
[Continue Reading](https://lightningchart.com/blog/trader/bollinger-bands-explained/#start-page)
**Written by a human \| Updated on April 24th, 2025**
#### TABLE OF CONTENTS
- [Introduction](https://lightningchart.com/blog/trader/bollinger-bands-explained/#start-page)
- [Historical Background](https://lightningchart.com/blog/trader/bollinger-bands-explained/#historical-background)
- [How to Read Bollinger Bands](https://lightningchart.com/blog/trader/bollinger-bands-explained/#how-to-read)
- [Bollinger Bands Formula](https://lightningchart.com/blog/trader/bollinger-bands-explained/#formula)
- [The Role of LightningChart JS Trader in Financial Analysis](https://lightningchart.com/blog/trader/bollinger-bands-explained/#lcjs-trader)
- [How to Create the Standard Error Bands Indicator Using LightningChart JS Trader](https://lightningchart.com/blog/trader/bollinger-bands-explained/#creating-indicator-lcjs)
- [Advantages and Limitations of Bollinger Bands](https://lightningchart.com/blog/trader/bollinger-bands-explained/#advantages-limitations)
- [Conclusion](https://lightningchart.com/blog/trader/bollinger-bands-explained/#conclusion)
## Introduction to **Bollinger Bands**
Bollinger Bands are one of the most widely used and effective technical analysis tools for analysing volatility and identifying potential trading opportunities in financial markets. Introduced by John Bollinger in the 1980s, these bands have become essential for stock, forex, and cryptocurrency traders alike, offering valuable insights into market trends and volatility.
In this guide, we’ll provide a complete explanation of Bollinger Bands, how they work, and their technical implementation. Whether you’re a beginner trader or a seasoned investor, understanding Bollinger Bands can give you a significant advantage.
### **What Are Bollinger Bands?**
Bollinger Bands are a volatility indicator consisting of three lines: a simple moving average (SMA) in the middle and two price bands above and below it. These outer bands represent standard deviations of the price, and they expand and contract based on the volatility in the market.
- Key Components of Bollinger Bands:
- **Middle Band (SMA):** The middle band is a Simple Moving Average (SMA) calculated over a predefined number of periods. The most common setting is a 20-day SMA, but this can be customized depending on the trader’s strategy or the asset’s price behaviour. The middle band serves as a baseline that reflects the average price over the specified period.
- **Upper Band:** The upper band is positioned a certain number of standard deviations above the SMA. The most common setting for the number of standard deviations is 2, which captures approximately 95% of the price data when assuming a normal distribution. The upper band indicates potential overbought conditions when the price approaches or breaches this level.
- **Lower Band:** The lower band is positioned the same number of standard deviations below the SMA. When the price approaches or breaches the lower band, it may signal oversold conditions. Traders often view this as a potential buying opportunity, especially if confirmed by other indicators.
Bollinger Bands respond to price movements, expanding when volatility increases and contracting when volatility decreases. They help traders identify overbought or oversold conditions and potential breakouts or reversals.
### Standard Deviation and Volatility
The Bollinger Bands use standard deviation, a statistical measure of dispersion, to adjust the distance between the upper and lower bands and the middle SMA. Volatility is reflected in how much the price deviates from the average over a given time. A higher standard deviation signifies greater volatility, causing the bands to widen, while a lower standard deviation signifies less volatility, leading to narrower bands. The formula for Standard Deviation (SD):

Where:
- ***Pi*** is the price at each time period.
- **?** is the number of periods.
- SMA is the simple moving average over ?
This formula captures the variability of prices over a given time frame. As volatility increases, the standard deviation widens, which in turn expands the distance between the bands, signaling increased market volatility.
## **Historical Background**
Bollinger Bands were introduced by John Bollinger, a financial analyst and trader, in the early 1980s. Prior to Bollinger’s innovation, technical analysts often used fixed-width bands to track price movements, but these did not adapt to changing market conditions. Bollinger realized that market volatility was dynamic, and fixed bands were often inadequate for capturing real-time market shifts.
By incorporating standard deviation into his bands, Bollinger was able to create a system that automatically adjusted to the volatility of the underlying asset. This made Bollinger Bands highly effective in various markets, including stocks, forex, commodities, and, more recently, cryptocurrencies.
### **Application in Financial Markets**
Bollinger Bands can be applied to various asset classes, including:
- **Stocks:** Traders often use Bollinger Bands to identify periods of consolidation before a breakout or to spot overbought/oversold conditions.
- **Forex:** In the highly liquid forex market, Bollinger Bands help traders identify price squeezes or reversals, which are common in currency pairs.
- **Cryptocurrency:** Due to the high volatility of cryptocurrencies, Bollinger Bands are particularly useful in spotting extreme price movements, such as the sharp price increases or drops often seen in assets like Bitcoin or Ethereum.
### **Why Bollinger Bands are Effective?**
One of the core reasons why Bollinger Bands are so widely adopted is their ability to dynamically adapt to changing market conditions. Many traditional technical indicators, like the Relative Strength Index (RSI) or Moving Average Convergence Divergence (MACD), operate within predefined ranges. However, Bollinger Bands adjust to volatility in real-time, making them effective in both trending and ranging markets.
### **Trend Identification**
Bollinger Bands help traders assess the strength of a trend. For example:
- In an uptrend, the price tends to hug the upper band. This suggests strong bullish momentum.
- In a downtrend, the price may consistently test the lower band, indicating persistent bearish pressure.
### **Volatility Breakouts**
Bollinger Bands are often used to predict volatility breakouts, which occur when the price moves aggressively out of a narrow range. The contraction of the bands (known as the Bollinger Band Squeeze) signals a period of low volatility, often preceding a breakout. When the bands expand, traders anticipate increased volatility, and the price may move significantly in one direction.
### **Overbought/Oversold Signals**
When prices move above the upper band, it is often interpreted as a signal that the market is overbought, meaning a correction could be imminent. Conversely, when prices move below the lower band, the market may be oversold, offering potential buying opportunities.
### **How Traders Use Bollinger Bands in Conjunction with Other Indicators?**
To increase the accuracy of trading signals, Bollinger Bands are often combined with other indicators such as the Relative Strength Index (RSI) or the MACD:
- **RSI:** Bollinger Bands combined with the RSI can help confirm whether an asset is genuinely overbought or oversold. For instance, if the price touches the upper band while the RSI is above 70, this reinforces the overbought signal.
- **MACD:** Traders might look for divergence between price movement and the MACD, using the Bollinger Bands to spot potential breakouts or reversals.
## **How to Read Bollinger Bands**
**Understanding the Relationship Between Price and Bands**
Bollinger Bands Explained in simple terms: the distance between the upper and lower bands represents market volatility. When the bands are close together, it signals low volatility. When they widen, volatility is increasing.
Here’s how to read Bollinger Bands:
- **When the price touches or crosses the upper band:** The asset may be overbought, signaling a potential reversal or correction.
- **When the price touches or crosses the lower band:** The asset may be oversold, indicating a potential upward reversal.
- **When the price consistently hovers around the middle band:** This usually signals a neutral market or trend consolidation.
**Interpreting Volatility with Bollinger Bands**
Traders can gauge volatility by observing the expansion and contraction of the Bollinger Bands. If the bands contract (narrow), it indicates that volatility is decreasing, often signaling a potential breakout as the market prepares for a price move. When the bands expand (widen), it reflects increasing volatility, often following a breakout.
**LightningChart JS Trader and Bollinger Bands**
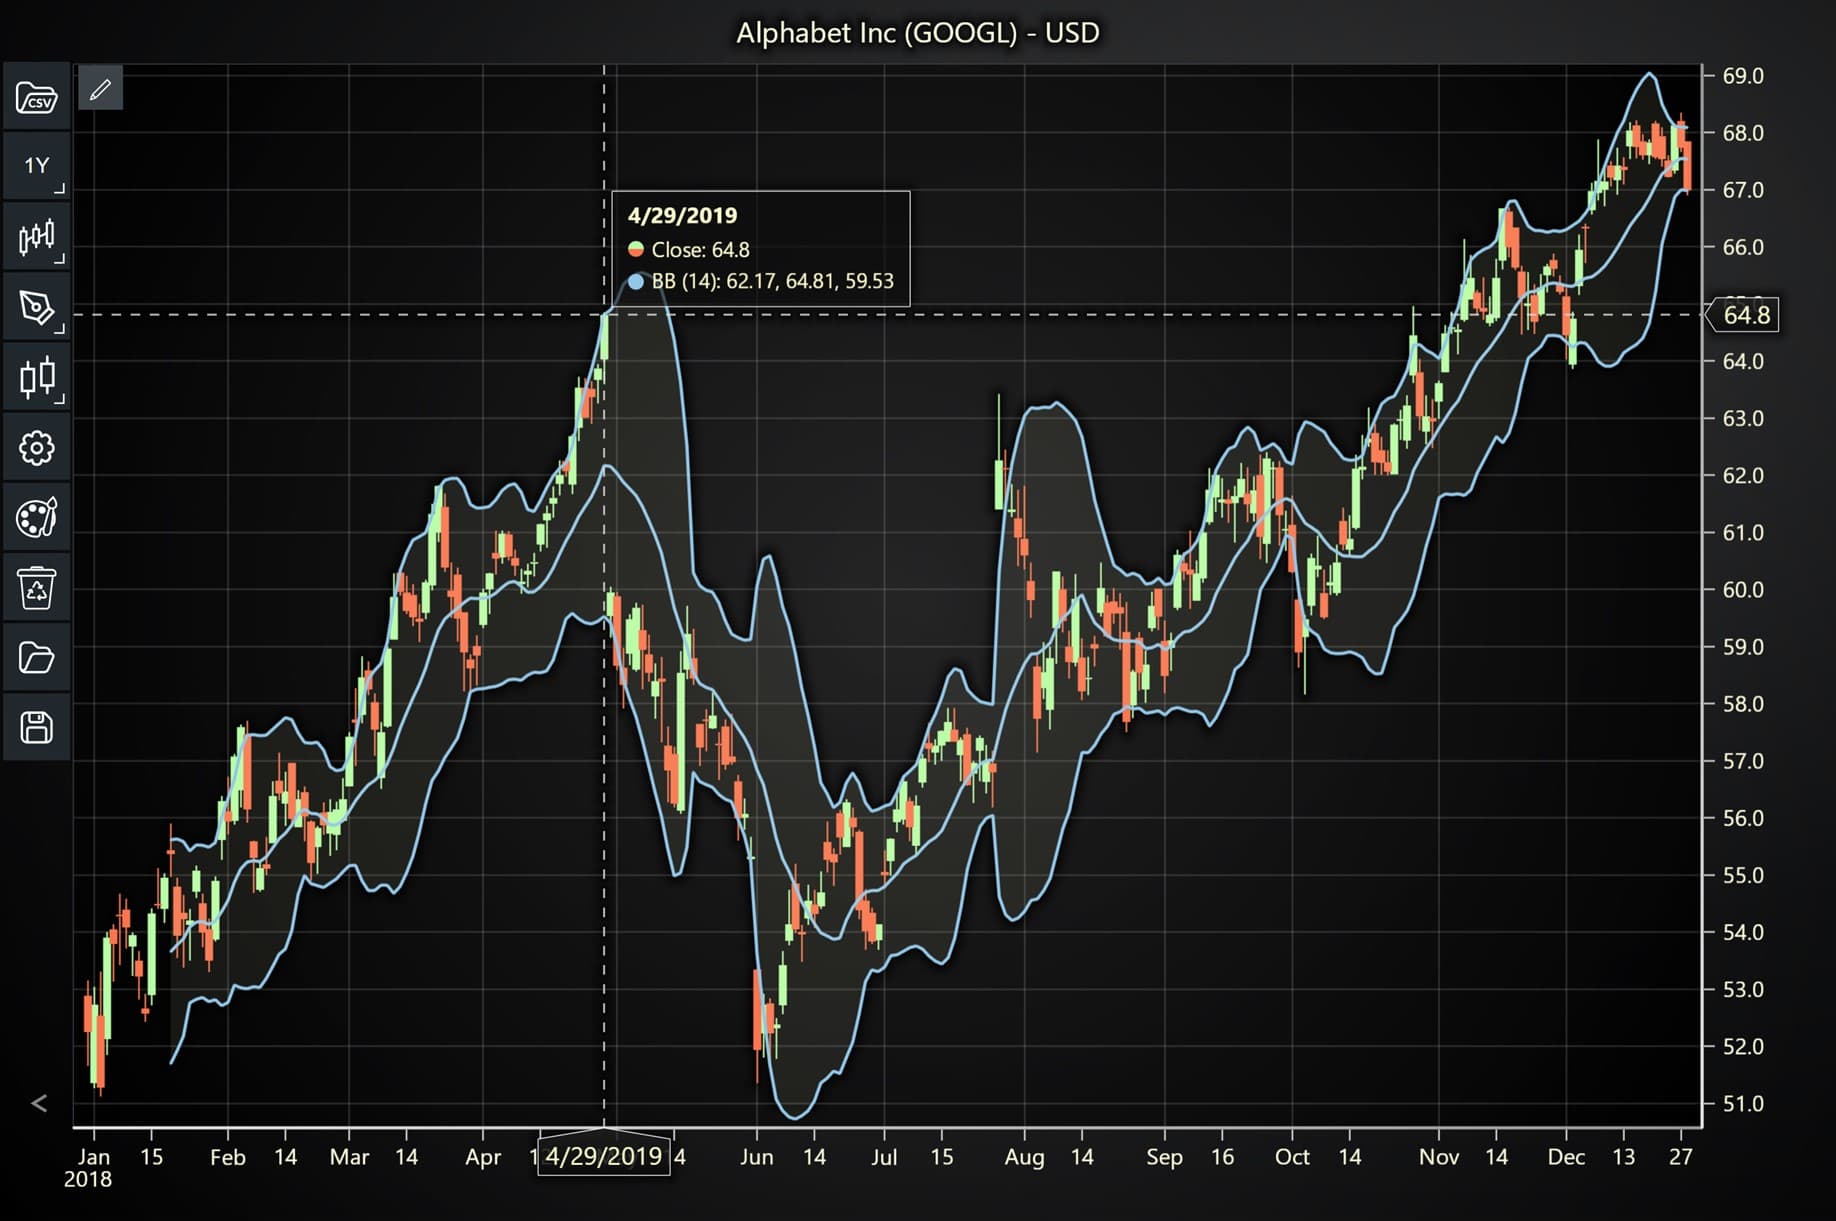
LCJS Trader is a platform that integrates advanced charting tools, including Bollinger Bands. Using this platform, traders can easily apply Bollinger Bands to financial instruments, allowing for real-time analysis of volatility and trend patterns. By observing how price interacts with the Bollinger Bands, traders can make more informed decisions about entry and exit points. Let’s explore the chart below to explain how the Bollinger Bands Indicator works in LCJS Trader platform:

This chart shows the price action of Alphabet Inc (GOOGL) using Bollinger Bands indicator. In the settings panel, you can see that the following settings were used for this chart:
- **Source:** Close prices are used to calculate the Bollinger Bands.
- **Period Count:** 14 periods are used to calculate the moving average (SMA). This is the number of past data points used in each calculation.
- **Standard Deviations:** The chart uses 2 standard deviations, which is a common default setting for Bollinger Bands. This ensures that the upper and lower bands capture about 95% of the price action assuming normal price distribution.
- **Line Width, Line Color, and Fill Color:** These are the visual settings for how the bands appear on the chart. The yellow-colored lines and shaded area indicate the region between the upper and lower bands.
The Bollinger Bands used in the chart consist of three lines plotted over the price action:
- **Upper Band:** The upper yellow line represents two standard deviations above a moving average.
- **Middle Band:** The center yellow line is a 14-period Simple Moving Average (SMA), used in this specific chart.
- **Lower Band:** The lower yellow line represents two standard deviations below the moving average.
The tooltip shows the stock’s price on October 28, 2019:
- Close Price: 64.4 USD
- Bollinger Bands Values:
- Upper Band: 64.28
- Middle Band: 62.08 (14-period SMA)
- Lower Band: 59.89
### **Interpreting the Chart**
The Bollinger Bands in this chart visually show the volatility of Alphabet’s stock price. As the price fluctuates, the bands widen or narrow. Widening bands (as seen in certain parts of the chart) indicate increased volatility, while narrowing bands suggest periods of lower volatility.
- **Volatility:**
Throughout the chart, you can see periods where the bands expand and contract. When the bands are far apart, it indicates high volatility, like in June and October. When the bands are closer together (early January to March), it reflects lower volatility.
- **Price Reversal Potential:**
Typically, when the price touches or crosses the upper band, it signals overbought conditions, and when it touches or falls below the lower band, it signals oversold conditions. This does not necessarily mean an immediate reversal but rather highlights extreme price movement. For example, in late October, the price is near the upper band, and the upper and lower bands are wide apart, indicating high volatility and a possible continuation of an upward trend. However, if the price sharply retracts from the upper band, it could suggest a pullback or correction.
## **Bollinger Bands Explained: Formula**
To understand how Bollinger Bands are calculated, let’s break it down step by step.
### **How to Calculate Bollinger Bands:**
1. **Middle Band:** The middle band is typically a 20-day simple moving average (SMA) of the closing prices. Formula:
**Middle Band = SMA(20)**
1. **Upper Band:** The upper band is calculated by adding two standard deviations to the middle band. Formula:
**Upper Band = SMA(20) + (20-day Standard Deviation × 2)**
1. **Lower Band:** The lower band is calculated by subtracting two standard deviations from the middle band. Formula:
**Lower Band = SMA(20) − (20-day Standard Deviation × 2)**
These formulas dynamically adjust to market conditions, ensuring that Bollinger Bands accurately represent volatility and provide real-time insights.
### **How Do Traders Use Bollinger Bands in Forex Trading?**
Forex traders commonly use Bollinger Bands to identify overbought and oversold conditions. When the price approaches the upper band, it may signal a selling opportunity, while approaching the lower band could indicate a buying opportunity. Bollinger Bands are particularly useful in trending markets and during periods of consolidation in forex trading.
Common Forex Bollinger Bands Trading Strategies:
1. **Bollinger Band Squeeze (Breakout Strategy):**
When the bands contract, it indicates low volatility, often preceding a breakout. Traders look for price to break either above the upper band (bullish signal) or below the lower band (bearish signal).
1. **Riding the Bands (Trend Following Strategy):**
In a strong trend, the price can “ride the band,” especially when it moves along the upper or lower band. In a bullish trend, traders might hold positions as long as the price remains near the upper band. In a bearish trend, traders might hold short positions as long as the price hugs the lower band.
1. **Reversal Strategy:**
When the price touches the upper or lower band, some traders interpret it as an overbought or oversold signal, respectively. They may look for confirmation of a reversal before entering a trade.
## **The Role of LightningChart JS Trader in Financial Analysis**
[](https://lightningchart.com/js-charts/trader/)
Financial analysis involves examining historical data to forecast future trends, make informed decisions, and assess risk. In this domain, applications like **LightningChart JS Trader** serve a critical role by providing real-time, high-performance data visualization tools that help traders and analysts better interpret complex datasets. It enables traders to track market trends using built-in indicators.
The platform’s ability to handle large datasets and real-time updates makes it essential for fast decision-making in dynamic markets. Additionally, its customization options allow users to create tailored charts and apply statistical indicators, enhancing both the precision of analysis and risk management. This tool helps streamline financial analysis and supports more informed, data-driven trading strategies.
## **How to Create the Bollinger Bands Using LightningChart JS Trader**
**Step 1: Get LightningChart JS Trader**
To begin, you’ll need access to [**LightningChart JS Trader**](https://lightningchart.com/js-charts/trader/). This library provides the tools necessary to create advanced technical indicators, including Bollinger Bands. Visit the LightningChart JS Trader page to download the required components and to review the [**documentation**](https://lightningchart.com/js-charts/trader/docs/).
**Step 2: Review the Interactive Example**
LightningChart JS Trader includes [**interactive examples**](https://lightningchart.com/js-charts/trader/interactive-examples/?disable-animations=1&isList=true) that demonstrate how to create custom technical indicators. Start by reviewing the documentation, focusing on how to integrate Bollinger Bands into your chart setup. The interactive examples will guide you through the process of setting up the Bollinger Bands, from importing the necessary modules to modify the chart settings.
**Step 3: Code Explanation**
In this step, we will break down the code that creates the chart with the Bollinger Bands, as shown in the image, using LightningChart JS Trader. The code demonstrates how to initialize a trading chart, apply the Bollinger Bands, and customize its appearance.
Here’s a detailed breakdown of each section:
**A. Importing the Required Libraries:**
```
1 const lcjsTrader = require('@arction/lcjs-trader') 2 const lcjs = require('@arction/lcjs') 3 const { Themes } = lcjsCopy Code
```
- **lcjsTrader**: This library provides access to the LightningChart JS Trader functionalities, allowing you to create advanced financial charts.
- **lcjs**: The main LightningChart JS library is used for general charting functionality.
- **Themes**: A property within **lcjs** that provides access to pre-built themes. In this case, we are using the **`darkGold`** theme to style the chart.
**B. Initializing the Trading Chart:**
```
1 lcjsTrader.trader(TRADER_LICENSE).then(async (trader) => { 2 // Create a trading chart. 3 const tradingChart = trader.tradingChart({ loadFromStorage: false, colorTheme: Themes.darkGold })Copy Code
```
- **trader(TRADER\_LICENSE)**: Initializes the LightningChart JS Trader with the provided license key (TRADER\_LICENSE). This is required to access the charting functionalities for financial data.
**Note you can request a LightningChart JS Trader** [**trial license**](https://lightningchart.com/js-charts/trader/)**, which is free.**
- **`tradingChart()`**: This function creates a trading chart with certain options. In this example:
- **`loadFromStorage`:** **false**: This disables the loading of previously stored chart data from local storage, ensuring a fresh chart setup.
- **`colorTheme`:** **Themes.darkGold**: This applies the **darkGold** theme to the chart which influences the background color, grid lines, and other visual elements.
**C. Adding and Customizing the Bollinger Bands Indicator**
```
1 // Add a Bollinger Band indicator 2 const bb = tradingChart.indicators().addBollingerBand() 3 bb.setPeriodCount(14) 4 bb.setStandardDeviationNumber(2) 5 bb.setLineColor('#8fc8eb') 6 bb.setLineWidth(2)Copy Code
```
- **`addBollingerBand()`:** This function adds the Bollinger Bands (BB) indicator to the trading chart. Bollinger Bands help identify volatility in the market by plotting bands around a Simple Moving Average (SMA) based on a set number of standard deviations. These bands adjust dynamically as price volatility increases or decreases, making them a valuable tool for identifying potential overbought or oversold conditions.
- **`setPeriodCount(14)`:** This sets the period for calculating the Simple Moving Average (SMA) and the width of the Bollinger Bands to 14 periods. A shorter period makes the bands react more quickly to price changes, while a longer period smooths out the movements.
- **`setStandardDeviationNumber(2)`:** This defines the number of standard deviations used to calculate the distance between the middle SMA line and the upper/lower bands. A value of 2 is the default and most common setting, meaning the bands are placed two standard deviations away from the SMA, covering roughly 95% of price action.
- **`setLineColor('#8fc8eb')`:** This sets the color of the Bollinger Bands to a light blue shade (\#8fc8eb). Changing the line color helps improve visibility against different chart backgrounds.
- **`setLineWidth(2)`:** This sets the thickness of the Bollinger Bands’ lines to 2 pixels, making them more prominent and easier to distinguish on the chart, especially when price movements become erratic.
**D. Loading Data from a CSV File**
```
1 // Reading data from a file. 2 await fetch(`${document.head.baseURI}examples/assets/0000/Alphabet Inc (GOOGL).csv`).then((res) => res.text()).then((text) => { 3 tradingChart.readCsvString(text, 'Alphabet Inc (GOOGL)') 4 })Copy Code
```
- **`fetch()`**: This function retrieves a CSV file containing historical data for Alphabet Inc. (GOOGL). The CSV file includes pricing information for the company’s stock, which is plotted on the chart.
- **`readCsvString()`**: This function reads the CSV data and interprets it as pricing data for Alphabet Inc. The second argument (‘Alphabet Inc (GOOGL)’) sets the label for the chart, as seen at the top of the chart image.
**E. Setting the Currency for the Chart**
```
1 tradingChart.setCurrency('USD') 2 })Copy Code
```
- **`setCurrency('USD')`**: This sets the currency of the chart to USD, ensuring that the pricing data is interpreted and displayed in US dollars.
## **Advantages and Limitations of Bollinger Bands**
**Advantages**
- **Adaptability:** Bollinger Bands automatically adjust to changing market conditions, making them a versatile tool in any market.
- **Visualize Volatility:** They provide a clear picture of market volatility, helping traders anticipate price breakouts and reversals.
- **Multiple Applications:** Bollinger Bands can be used in a variety of strategies, including breakout, trend-following, and reversal strategies.
**Limitations:**
- **Lagging Indicator:** As Bollinger Bands rely on moving averages, they are considered lagging indicators and may not react immediately to rapid price changes.
- **False Signals:** In ranging markets, Bollinger Bands can sometimes give false signals, leading to whipsaw trades.
- **Requires Confirmation:** Bollinger Bands should not be used in isolation; traders often need to combine them with other indicators like RSI or MACD for confirmation.
## Conclusion
Bollinger Bands are an essential tool for traders looking to analyze volatility and identify potential price movements in financial markets. Whether you’re trading stocks, forex, or cryptocurrencies, understanding how to read and use Bollinger Bands effectively can significantly improve your trading strategy. From the basic calculation of the bands to advanced applications in forex trading, Bollinger Bands offer traders a versatile and adaptive way to navigate the complexities of the market.
- **Key Takeaways:**
- Bollinger Bands helps visualize market volatility and trend direction.
- They can be used in multiple trading strategies, including breakouts, reversals, and trend-following.
- Proper implementation of Bollinger Bands, especially in tools like LCJS Trader, can significantly enhance technical analysis.
By mastering the Bollinger Bands Explained indicator, you’ll have a robust tool for making more informed trading decisions.
[Get started with LightningChart JS Trader](https://lightningchart.com/js-charts/trader/)

## Ahmad Omid
Data Science Developer
[](https://www.linkedin.com/in/ahmad-omid/)

## Continue learning with LightningChart
[](https://lightningchart.com/blog/debunking-scicharts-performance/)
## [Debunking SciChart’s Performance](https://lightningchart.com/blog/debunking-scicharts-performance/)
Learn about SciChart’s misleading benchmark performance metrics that distort how a real high-end chart library performs.
Page 1 of 3861[2](https://lightningchart.com/blog/trader/bollinger-bands-explained/page/2/?et_blog "Page 2")[3](https://lightningchart.com/blog/trader/bollinger-bands-explained/page/3/?et_blog "Page 3")...[»](https://lightningchart.com/blog/trader/bollinger-bands-explained/page/2/?et_blog)[Last »](https://lightningchart.com/blog/trader/bollinger-bands-explained/page/386/?et_blog)
[](https://lightningchart.com/blog/trader/swing-index-indicator/)
## [Swing index indicator: formula and implementation with LC JS Trader](https://lightningchart.com/blog/trader/swing-index-indicator/)
Learn the Swing Index indicator formula and implementation with LightningChart JS Trader to detect trend direction and refine trading signals.
Page 1 of 11
[](https://lightningchart.com/blog/trader/supertrend-indicator/)
## [How to use the Supertrend indicator for Fintech app development](https://lightningchart.com/blog/trader/supertrend-indicator/)
Learn about the Supertrend indicator in fintech app development to generate clear buy and sell signals, optimize ATR settings, and enhance trading strategies.
Page 1 of 11

[](https://www.linkedin.com/company/lightningchart-ltd/) [](https://www.facebook.com/LightningChart) [](https://x.com/Lightning_Chart) [](https://www.instagram.com/lightningchartltd/) [](https://www.youtube.com/channel/UCQA9NVRmqAspjJj2OKzrkmw) [](https://www.tiktok.com/@lightningchart)
LightningChart .NET [Product page](https://lightningchart.com/net-charts/) [Resources](https://lightningchart.com/net-charts/resources/) [Free 30-days Trial](https://portal.lightningchart.com/loadform?view_name=free_or_trial_version_form&product_id=35&_ga=2.131986503.971767503.1595248832-619022658.1595248832)
LightningChart JS [Product page](https://lightningchart.com/js-charts/) [Documentation](https://lightningchart.com/js-charts/docs/) [Free 30-days Trial](https://lightningchart.com/js-charts/)
LightningChart Trader [Product page](https://lightningchart.com/js-charts/trader/) [Interactive Examples](https://lightningchart.com/js-charts/trader/interactive-examples/?disable-animations=1&isList=false) [Documentation](https://lightningchart.com/js-charts/trader/docs/)
LightningChart Python [Product page](https://lightningchart.com/python-charts/) [Documentation](https://lightningchart.com/python-charts/docs/) [Gallery](https://lightningchart.com/python-charts/docs/features/) [Free 7-days Trial](https://lightningchart.com/python-charts)
[EULA](https://lightningchart.com/eula/) [Privacy Policy](https://lightningchart.com/privacy-policy/) [Terms & Conditions](https://lightningchart.com/terms-and-conditions/) [Partners & Resellers](https://lightningchart.com/partners/) [Testimonials](https://lightningchart.com/testimonials/)
[News](https://lightningchart.com/news/) [Our Story](https://lightningchart.com/our-story/) [About Us](https://lightningchart.com/about-us/) [Students](https://lightningchart.com/free-license-for-students/) [Affiliates](https://lightningchart.com/affiliates/)
   
 
LightningChart .NET [Product page](https://lightningchart.com/net-charts/) [Resources](https://lightningchart.com/net-charts/resources/) [Free 30-day Trial](https://portal.lightningchart.com/loadform?view_name=free_or_trial_version_form&product_id=35&_ga=2.131986503.971767503.1595248832-619022658.1595248832)
LightningChart JS [Product page](https://lightningchart.com/js-charts/) [Documentation](https://lightningchart.com/js-charts/docs/) [Free 30-days Trial](https://lightningchart.com/js-charts/)
LightningChart Trader [Product page](https://lightningchart.com/js-charts/trader/) [Interactive Examples](https://lightningchart.com/js-charts/trader/interactive-examples/?disable-animations=1&isList=false) [Documentation](https://lightningchart.com/js-charts/trader/docs/)
LightningChart Python [Product page](https://lightningchart.com/python-charts/) [Documentation](https://lightningchart.com/python-charts/docs/) [Gallery](https://lightningchart.com/python-charts/docs/features/) [Free 7-days Trial](https://lightningchart.com/python-charts)
[EULA](https://lightningchart.com/eula/) [Privacy Policy](https://lightningchart.com/privacy-policy/) [Terms & Conditions](https://lightningchart.com/terms-and-conditions/) [Partners & Resellers](https://lightningchart.com/partners/) [Testimonials](https://lightningchart.com/testimonials/)
[News](https://lightningchart.com/news/) [Our Story](https://lightningchart.com/our-story/) [About Us](https://lightningchart.com/about-us/) [Students](https://lightningchart.com/free-license-for-students/) [Affiliates](https://lightningchart.com/affiliates/)
   
 
If you have any questions, feel free to contact us\!
[Contact Us](https://lightningchart.com/contact/)
©LightningChart Ltd 2026. All rights reserved.
##### **We value your privacy.**
By continuing to use our website, you consent to our use of cookies.
Accept All
Reject All
Settings
Change cookie settings
Close GDPR Cookie Settings

- Privacy Overview
- Strictly Necessary Cookies
- 3rd Party Cookies
[Powered by GDPR Cookie Compliance](https://wordpress.org/plugins/gdpr-cookie-compliance/)
Privacy Overview
This website uses cookies so that we can provide you with the best user experience possible. Cookie information is stored in your browser and performs functions such as recognising you when you return to our website and helping our team to understand which sections of the website you find most interesting and useful.
Strictly Necessary Cookies
Strictly Necessary Cookie should be enabled at all times so that we can save your preferences for cookie settings. This includes Google Cookies that prove you are not a robot.
Enable or Disable Cookies
Enabled Disabled
3rd Party Cookies
This website uses Google Analytics to collect anonymous information such as the number of visitors to the site, and the most popular pages.
Keeping this cookies enabled helps us to improve our website.
Enable or Disable Cookies
Enabled Disabled
Enable All
Reject All
Save Changes |
| Readable Markdown | Bollinger Bands were introduced by John Bollinger, a financial analyst and trader, in the early 1980s. Prior to Bollinger’s innovation, technical analysts often used fixed-width bands to track price movements, but these did not adapt to changing market conditions. Bollinger realized that market volatility was dynamic, and fixed bands were often inadequate for capturing real-time market shifts.
By incorporating standard deviation into his bands, Bollinger was able to create a system that automatically adjusted to the volatility of the underlying asset. This made Bollinger Bands highly effective in various markets, including stocks, forex, commodities, and, more recently, cryptocurrencies.
### **Application in Financial Markets**
Bollinger Bands can be applied to various asset classes, including:
- **Stocks:** Traders often use Bollinger Bands to identify periods of consolidation before a breakout or to spot overbought/oversold conditions.
- **Forex:** In the highly liquid forex market, Bollinger Bands help traders identify price squeezes or reversals, which are common in currency pairs.
- **Cryptocurrency:** Due to the high volatility of cryptocurrencies, Bollinger Bands are particularly useful in spotting extreme price movements, such as the sharp price increases or drops often seen in assets like Bitcoin or Ethereum.
### **Why Bollinger Bands are Effective?**
One of the core reasons why Bollinger Bands are so widely adopted is their ability to dynamically adapt to changing market conditions. Many traditional technical indicators, like the Relative Strength Index (RSI) or Moving Average Convergence Divergence (MACD), operate within predefined ranges. However, Bollinger Bands adjust to volatility in real-time, making them effective in both trending and ranging markets.
### **Trend Identification**
Bollinger Bands help traders assess the strength of a trend. For example:
- In an uptrend, the price tends to hug the upper band. This suggests strong bullish momentum.
- In a downtrend, the price may consistently test the lower band, indicating persistent bearish pressure.
### **Volatility Breakouts**
Bollinger Bands are often used to predict volatility breakouts, which occur when the price moves aggressively out of a narrow range. The contraction of the bands (known as the Bollinger Band Squeeze) signals a period of low volatility, often preceding a breakout. When the bands expand, traders anticipate increased volatility, and the price may move significantly in one direction.
### **Overbought/Oversold Signals**
When prices move above the upper band, it is often interpreted as a signal that the market is overbought, meaning a correction could be imminent. Conversely, when prices move below the lower band, the market may be oversold, offering potential buying opportunities.
### **How Traders Use Bollinger Bands in Conjunction with Other Indicators?**
To increase the accuracy of trading signals, Bollinger Bands are often combined with other indicators such as the Relative Strength Index (RSI) or the MACD:
- **RSI:** Bollinger Bands combined with the RSI can help confirm whether an asset is genuinely overbought or oversold. For instance, if the price touches the upper band while the RSI is above 70, this reinforces the overbought signal.
- **MACD:** Traders might look for divergence between price movement and the MACD, using the Bollinger Bands to spot potential breakouts or reversals. |
| Shard | 73 (laksa) |
| Root Hash | 15454917772885724873 |
| Unparsed URL | com,lightningchart!/blog/trader/bollinger-bands-explained/ s443 |