ℹ️ Skipped - page is already crawled
| Filter | Status | Condition | Details |
|---|---|---|---|
| HTTP status | PASS | download_http_code = 200 | HTTP 200 |
| Age cutoff | PASS | download_stamp > now() - 6 MONTH | 0.1 months ago |
| History drop | PASS | isNull(history_drop_reason) | No drop reason |
| Spam/ban | PASS | fh_dont_index != 1 AND ml_spam_score = 0 | ml_spam_score=0 |
| Canonical | PASS | meta_canonical IS NULL OR = '' OR = src_unparsed | Not set |
| Property | Value |
|---|---|
| URL | https://groww.in/blog/bollinger-bands |
| Last Crawled | 2026-04-10 07:25:53 (2 days ago) |
| First Indexed | 2026-02-16 07:39:27 (1 month ago) |
| HTTP Status Code | 200 |
| Meta Title | How to Use Bollinger Bands in Stock Trading | Groww |
| Meta Description | Learn how Bollinger Bands work, how to interpret volatility, and how traders use this popular technical indicator for entries, exits, and trend analysis. |
| Meta Canonical | null |
| Boilerpipe Text | Bollinger Bands are both versatile and one of the most widely used technical indicators in the trading world. Whether you are trading stocks, options, or futures, Bollinger Bands help you visualise price action for volatility, potential breakouts, or reversals defined by solid numbers.
In this guide, we will cover the basics of Bollinger Bands, how to use them, common errors, and real-world trading strategies.
Introduction to Bollinger Bands
Bollinger Bands are a volatility-based technical analysis indicator that consists of three calculation lines:
A Simple
Moving Average
(SMA)
An upper band
A lower band
The distance between the bands expands or contracts based on market volatility: when volatility is high, the bands expand, and when volatility is low, they narrow. Traders commonly use Bollinger Bands to identify overbought or oversold levels, pattern breakouts, and low-volatility areas that may signal future momentum.
Who Created Bollinger Bands?
Bollinger Bands are named after their creator, John Bollinger, who developed them in the 1980s. John utilised a dynamic technical indicator that could adapt to underlying market conditions, rather than the static trading ranges regularly used by traders. Currently, Bollinger Bands are a standard indicator on nearly all trading platforms.
How Bollinger Bands Are Calculated
The calculation of Bollinger Bands is done with a Simple Moving Average or SMA for the middle band and the standard deviations for the lower and upper bands. It is typically done over 20 periods, with the Middle Band being the 20-day SMA and the Upper Band being the SMA plus 2 standard deviations. The Lower Band in this case is the SMA, which is two standard deviations below the price to track price volatility.
Here are the steps for the calculation:
Middle Band (SMA):
For the set period (say 20 days), sum the closing prices and then divide them by the number of periods. This will calculate the 20-day Simple Moving Average.
Standard Deviation:
Work out the standard deviation for the exact price figures (say 20 days) used for the SMA. This measures the price volatility.
Upper Band:
Add the standard deviation (multiplied by the set factor, mostly 2) to the Middle Band. So, it is the Standard Deviation x 2 + Middle Band.
Lower Band:
Deduct the standard deviation (multiplied by the same factor, mostly 2) from the Middle Band. So, in this case, it is Middle Band - Standard Deviation x 2.
Components of Bollinger Bands
Here are some of the main components of Bollinger bands.
➤ Middle Band (Simple Moving Average)
Usually, a 20-period Simple Moving Average (SMA).
It is primarily helpful for establishing a baseline or trend for the indicator.
➤ Upper and Lower Bands (Standard Deviations)
Plotted two standard deviations below and above the middle SMA line
representation of price volatility with st. Dev. indicating volatility: wider bands = high; narrower bands = low
Formula:
Upper Band = SMA + (2 × Standard Deviation)
Lower Band = SMA - (2 × Standard Deviation)
How to Interpret Bollinger Bands
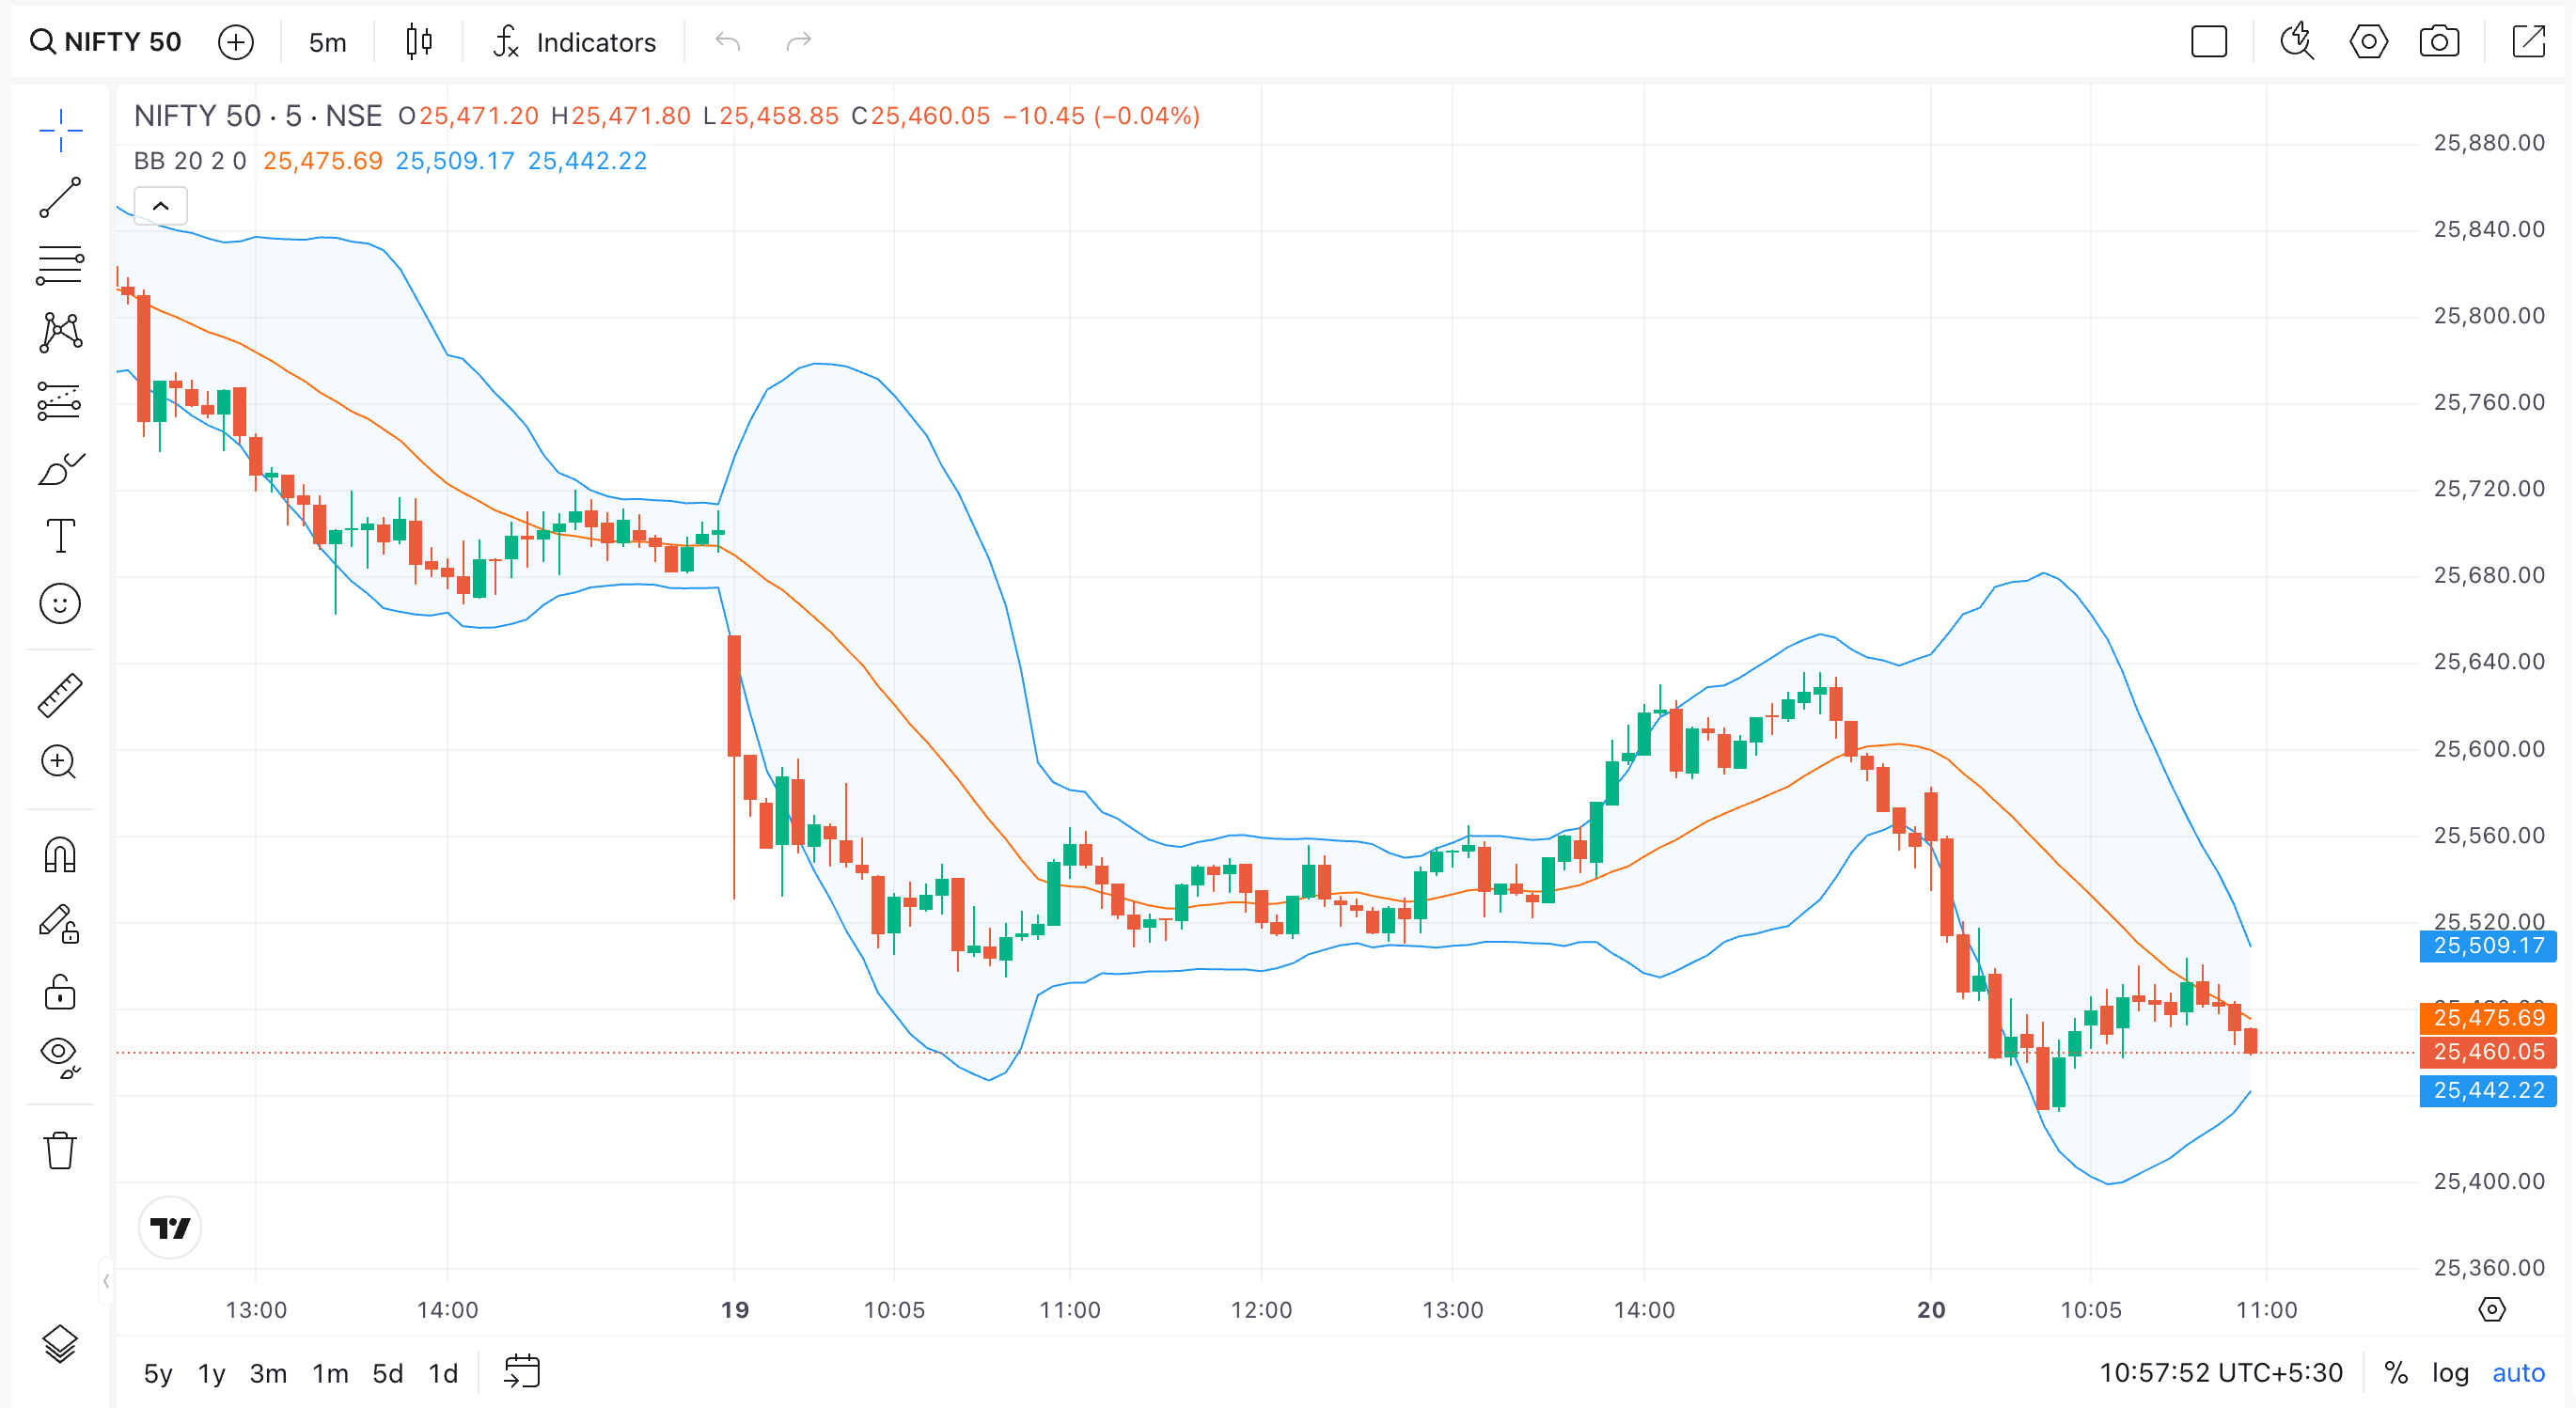
Bollinger Bands are an effective technical indicator that helps traders visualise price squeezes, low volatility, and gaps, as well as potential trading opportunities. A Bollinger Band is made up of three bands: a central band (the default setting is a 20-period Simple Moving Average), and two outer bands that are two standard deviations away from the central band. Here is how to correctly interpret a Bollinger Band:
When the bands come together and contract closely, it signals a Bollinger Band squeeze, a sign of low volatility. Typically, this is viewed as a warning to traders that a sharp price movement or breakout is imminent, either up or down. Traders keep a close eye on squeezes because they can quickly develop into a profitable trade setup.
When price comes in contact with, or breaches, an upper or lower band, it indicates that price is either overbought (upper band) or oversold (lower band). However, it is important to note that just because the price is touching the upper or lower band, it does not mean it is an automatic signal for price reversal; price can and often will continue up or down in the direction of the trend, especially in a strong bullish or bearish market.
When the price can ride the upper band, it indicates strong bullish momentum. When price consistently trades in the lower band, it should be viewed as bearish momentum.
Traders use volume to confirm a breakout (or potential reversal). To increase projections, traders often add Bollinger Bands alongside other indicators, such as RSI, MACD, or Moving Average
crossovers
.
In summary, while Bollinger Bands can identify squeezes, breakouts, and overextensions, it is always a good idea to have other confirmation tools to make your profits more reliable!
Trading Strategies Using Bollinger Bands
Here are some of the trading strategies you can deploy with Bollinger bands.
Mean Reversion Strategy
Assumes price will revert to the middle band after reaching the upper or lower band
Ideal for
range-bound or sideways markets
Entry:
Buy near the lower band, sell near the upper band
Stop-loss:
Just outside the bands
Take profit:
Near the middle band (SMA)
Trend Following Strategy
Enter trades in the direction of a
confirmed breakout
Works best in
strong trending markets
Entry:
On breakout with volume confirmation
Stop-loss:
Inside the band
Take profit:
Ride the trend, using trailing stops.
For
options
, Bollinger Bands can pair well with strategies like
straddles or strangles
, especially when anticipating volatility expansion.
Common Mistakes to Avoid
Here are some common errors worth avoiding.
Assuming all breakouts are sustainable
: Many of them are false without volume confirmation.
Ignoring trend direction:
Bollinger Bands work best when combined with trend analysis.
Using fixed settings for all assets:
Adjust the moving average period and standard deviation to suit different instruments or timeframes.
Forcing trades in a low-volatility market:
Sometimes, the best trade is no trade.
Combining Bollinger Bands with Other Indicators
To improve accuracy, combine Bollinger Bands with:
Moving Average Crossover Patterns
Relative Strength Index (RSI)
to confirm overbought or oversold conditions
MACD
to track momentum shifts
Golden Crossover Strategy
for long-term trend confirmation (Golden Crossover Strategy)
Option Chain and Implied Volatility
to optimise options trades (Option Chain, Implied Volatility in Options)
Risk Management & Position Sizing with Bollinger Bands
When managing risks with Bollinger Bands, use the band width for position sizing: a smaller size for high volatility/wider bands and a larger size for lower volatility/narrower bands. You also have to set stops below the lower band for long trades or above the upper band for shorter trades. Here are some key aspects worth noting in terms of risk management and position sizing:
Placing Stop-Loss:
Put stops right outside the bands, i.e. below the lower band for a long trade and above the upper band for a short trade.
Volatility-based Position Sizing:
You can adjust the trade size based on the volatility bandwidth. In this case, it equates to smaller positions during wide bands or high volatility, and possibly larger positions during narrow bands or low volatility periods.
Dynamic Resistance or Support:
The upper band may be used as resistance, while the lower band can be used as support for any mean-reversion trades. However, being careful about breakouts is necessary in this case.
Position Sizing for High Volatility:
For wide bands, lower the position size to restrict possible losses arising from bigger price swings.
Position Sizing for Low Volatility:
In the case of narrow bands, it suggests a potential big move. You may take slightly larger positions with tighter stops, or wait until the breakout is confirmed.
Considerations:
Ensure your potential reward justifies your overall risk, using the band levels to set targets. Always use Bollinger Bands in conjunction with added indicators, such as the RSI (Relative Strength Index) or the MACD (Moving Average Convergence Divergence).
Bollinger Squeeze:
Watch for narrow-band periods that precede volatility. However, strict stops are necessary, since breakouts may eventually be false in such cases. |
| Markdown | Stocks
[Invest in Stocks Invest in stocks, ETFs, IPOs with fast orders. Track returns on your stock holdings and view real-time P\&L on your positions.](https://groww.in/stocks)
[Intraday Monitor top intraday performers in real time](https://groww.in/stocks/intraday)
[ETF Screener Get the best of Mutual Funds and flexibility of Stocks](https://groww.in/etfs)
[IPO Track upcoming and ongoing IPOs](https://groww.in/ipo)
[MTFs Buy now, pay later](https://groww.in/stocks/mtf)
[Stock Screener Filter based on RSI, PE ratio and more](https://groww.in/stocks/filter)
[Stock Events Dividends, bonus, buybacks and more](https://groww.in/stocks/calendar)
[Demat Account Begin your stock market journey](https://groww.in/open-demat-account)
[Share Market Today Live news updates from stock market](https://groww.in/share-market-today)
F\&O
[Trade in Futures & Options Trade in F\&O using the terminal. View charts, indicators, track your orders , P\&L and watchlists in a single space](https://groww.in/futures-and-options)
[Indices Track markets across the globe](https://groww.in/indices)
[Terminal Track charts, orders, positions, watchlists in one place](https://groww.in/charts)
[Option chain Analyse chains, view payoffs, create baskets](https://groww.in/options/nifty)
[Pledge Get extra balance for trading](https://groww.in/available-for-pledge)
[Commodities Trade in Crude Oil, Gold, Silver and more](https://groww.in/commodities)
[API trading Set up and execute trades through our API](https://groww.in/trade-api)
Mutual Funds
[Invest in Mutual Funds Invest in direct mutual funds at zero charges via lump sump investments or SIPs](https://groww.in/mutual-funds)
[Mutual Fund Houses Know about AMCs, funds, fund managers](https://groww.in/mutual-funds/amc)
[NFO’s Track all active NFOs in one place](https://groww.in/nfo)
[Mutual Funds by Groww Mutual funds by Groww designed for your investment goals](https://groww.in/mutual-funds/amc/groww-mutual-funds)
[Start SIP Build long-term wealth through disciplined monthly investing.](https://groww.in/mutual-funds/start-sip)
[Mutual Funds screener Filter funds based on risk, fund size and more](https://groww.in/mutual-funds/filter)
[Track Funds Import funds and track all investments in a single place](https://groww.in/track)
[Compare Funds](https://groww.in/mutual-funds/compare)
More
[SIP calculator Estimate returns on a SIP](https://groww.in/calculators/sip-calculator)
[Brokerage calculator Estimate charges for your trade/investment](https://groww.in/calculators/brokerage-calculator)
[Margin calculator Estimate balance needed to buy/sell a stock](https://groww.in/calculators/margin-calculator)
[SWP calculator Returns on your systematic withdrawal plan](https://groww.in/calculators/swp-calculator)
[Pricing Brokerage and charges on Groww](https://groww.in/pricing)
[Blog](https://groww.in/blog)
# What Are Bollinger Bands? Meaning, Formula & Trading Strategy
16 February 2026
6 min read


Bollinger Bands are both versatile and one of the most widely used technical indicators in the trading world. Whether you are trading stocks, options, or futures, Bollinger Bands help you visualise price action for volatility, potential breakouts, or reversals defined by solid numbers.
In this guide, we will cover the basics of Bollinger Bands, how to use them, common errors, and real-world trading strategies.
## **Introduction to Bollinger Bands**
Bollinger Bands are a volatility-based technical analysis indicator that consists of three calculation lines:
- A Simple [Moving Average](https://groww.in/p/moving-average-crossover-pattern) (SMA)
- An upper band
- A lower band
The distance between the bands expands or contracts based on market volatility: when volatility is high, the bands expand, and when volatility is low, they narrow. Traders commonly use Bollinger Bands to identify overbought or oversold levels, pattern breakouts, and low-volatility areas that may signal future momentum.
****
## **Who Created Bollinger Bands?**
Bollinger Bands are named after their creator, John Bollinger, who developed them in the 1980s. John utilised a dynamic technical indicator that could adapt to underlying market conditions, rather than the static trading ranges regularly used by traders. Currently, Bollinger Bands are a standard indicator on nearly all trading platforms.
## **How Bollinger Bands Are Calculated**
The calculation of Bollinger Bands is done with a Simple Moving Average or SMA for the middle band and the standard deviations for the lower and upper bands. It is typically done over 20 periods, with the Middle Band being the 20-day SMA and the Upper Band being the SMA plus 2 standard deviations. The Lower Band in this case is the SMA, which is two standard deviations below the price to track price volatility.
Here are the steps for the calculation:
- **Middle Band (SMA):** For the set period (say 20 days), sum the closing prices and then divide them by the number of periods. This will calculate the 20-day Simple Moving Average.
- **Standard Deviation:** Work out the standard deviation for the exact price figures (say 20 days) used for the SMA. This measures the price volatility.
- **Upper Band:** Add the standard deviation (multiplied by the set factor, mostly 2) to the Middle Band. So, it is the Standard Deviation x 2 + Middle Band.
- **Lower Band:** Deduct the standard deviation (multiplied by the same factor, mostly 2) from the Middle Band. So, in this case, it is Middle Band - Standard Deviation x 2.
## **Components of Bollinger Bands**
Here are some of the main components of Bollinger bands.
### **➤ Middle Band (Simple Moving Average)**
- Usually, a 20-period Simple Moving Average (SMA).
- It is primarily helpful for establishing a baseline or trend for the indicator.
### **➤ Upper and Lower Bands (Standard Deviations)**
- Plotted two standard deviations below and above the middle SMA line
- representation of price volatility with st. Dev. indicating volatility: wider bands = high; narrower bands = low
**Formula:**
- Upper Band = SMA + (2 × Standard Deviation)
- Lower Band = SMA - (2 × Standard Deviation)
## **How to Interpret Bollinger Bands**
Bollinger Bands are an effective technical indicator that helps traders visualise price squeezes, low volatility, and gaps, as well as potential trading opportunities. A Bollinger Band is made up of three bands: a central band (the default setting is a 20-period Simple Moving Average), and two outer bands that are two standard deviations away from the central band. Here is how to correctly interpret a Bollinger Band:
- When the bands come together and contract closely, it signals a Bollinger Band squeeze, a sign of low volatility. Typically, this is viewed as a warning to traders that a sharp price movement or breakout is imminent, either up or down. Traders keep a close eye on squeezes because they can quickly develop into a profitable trade setup.
- When price comes in contact with, or breaches, an upper or lower band, it indicates that price is either overbought (upper band) or oversold (lower band). However, it is important to note that just because the price is touching the upper or lower band, it does not mean it is an automatic signal for price reversal; price can and often will continue up or down in the direction of the trend, especially in a strong bullish or bearish market.
- When the price can ride the upper band, it indicates strong bullish momentum. When price consistently trades in the lower band, it should be viewed as bearish momentum.
- Traders use volume to confirm a breakout (or potential reversal). To increase projections, traders often add Bollinger Bands alongside other indicators, such as RSI, MACD, or Moving Average [crossovers](https://groww.in/blog/how-to-use-golden-crossover-strategy).
- In summary, while Bollinger Bands can identify squeezes, breakouts, and overextensions, it is always a good idea to have other confirmation tools to make your profits more reliable\!
## **Trading Strategies Using Bollinger Bands**
Here are some of the trading strategies you can deploy with Bollinger bands.
### **Mean Reversion Strategy**
- Assumes price will revert to the middle band after reaching the upper or lower band
- Ideal for **range-bound or sideways markets**
**Entry:** Buy near the lower band, sell near the upper band
**Stop-loss:** Just outside the bands
**Take profit:** Near the middle band (SMA)
### **Trend Following Strategy**
- Enter trades in the direction of a **confirmed breakout**
- Works best in **strong trending markets**
**Entry:** On breakout with volume confirmation
**Stop-loss:** Inside the band
**Take profit:** Ride the trend, using trailing stops.
For [options](https://groww.in/blog/best-indicators-for-option-trading), Bollinger Bands can pair well with strategies like **straddles or strangles**, especially when anticipating volatility expansion.
## **Common Mistakes to Avoid**
Here are some common errors worth avoiding.
- **Assuming all breakouts are sustainable**: Many of them are false without volume confirmation.
- **Ignoring trend direction:** Bollinger Bands work best when combined with trend analysis.
- **Using fixed settings for all assets:** Adjust the moving average period and standard deviation to suit different instruments or timeframes.
- **Forcing trades in a low-volatility market:** Sometimes, the best trade is no trade.
## **Combining Bollinger Bands with Other Indicators**
To improve accuracy, combine Bollinger Bands with:
- **Moving Average Crossover Patterns**
- **Relative Strength Index (RSI)** to confirm overbought or oversold conditions
- **MACD** to track momentum shifts
- **Golden Crossover Strategy** for long-term trend confirmation (Golden Crossover Strategy)
- **Option Chain and Implied Volatility** to optimise options trades (Option Chain, Implied Volatility in Options)
## **Risk Management & Position Sizing with Bollinger Bands**
When managing risks with Bollinger Bands, use the band width for position sizing: a smaller size for high volatility/wider bands and a larger size for lower volatility/narrower bands. You also have to set stops below the lower band for long trades or above the upper band for shorter trades. Here are some key aspects worth noting in terms of risk management and position sizing:
- **Placing Stop-Loss:** Put stops right outside the bands, i.e. below the lower band for a long trade and above the upper band for a short trade.
- **Volatility-based Position Sizing:** You can adjust the trade size based on the volatility bandwidth. In this case, it equates to smaller positions during wide bands or high volatility, and possibly larger positions during narrow bands or low volatility periods.
- **Dynamic Resistance or Support:** The upper band may be used as resistance, while the lower band can be used as support for any mean-reversion trades. However, being careful about breakouts is necessary in this case.
- **Position Sizing for High Volatility:** For wide bands, lower the position size to restrict possible losses arising from bigger price swings.
- **Position Sizing for Low Volatility:** In the case of narrow bands, it suggests a potential big move. You may take slightly larger positions with tighter stops, or wait until the breakout is confirmed.
- **Considerations:** Ensure your potential reward justifies your overall risk, using the band levels to set targets. Always use Bollinger Bands in conjunction with added indicators, such as the RSI (Relative Strength Index) or the MACD (Moving Average Convergence Divergence).
- **Bollinger Squeeze:** Watch for narrow-band periods that precede volatility. However, strict stops are necessary, since breakouts may eventually be false in such cases.
### Disclaimer
The stocks mentioned in this article are not recommendations. Please conduct your own research and due diligence before investing. Investment in securities market are subject to market risks, read all the related documents carefully before investing. Please read the Risk Disclosure documents carefully before investing in Equity Shares, Derivatives, Mutual fund, and/or other instruments traded on the Stock Exchanges. As investments are subject to market risks and price fluctuation risk, there is no assurance or guarantee that the investment objectives shall be achieved. Groww Invest Tech Pvt. Ltd. (Formerly known as Nextbillion Technology Pvt. Ltd) Ltd. do not guarantee any assured returns on any investments. Past performance of securities/instruments is not indicative of their future performance.
Do you like this edition?
[LEAVE A FEEDBACK](https://trygroww.typeform.com/to/Do49ICvJ)
Trade in F\&O at Groww
Explore advance features, multiple indicators & more
[DOWNLOAD NOW](https://groww.in/trading-app)
Recent Posts
[Om Power Transmission IPO Day 2: Check GMP, Subscription Status & Key Highlights](https://groww.in/blog/om-power-transmission-ipo-day-2)[Gamma Risk Explained Through 0DTE Options](https://groww.in/blog/gamma-risk-explained-through-0-dte-options)[How to Trade Options When IV Is in the 80th Percentile](https://groww.in/blog/how-to-trade-options-when-iv-is-in-the-80th-percentile)[How to Trade Options in Times of Wars and Global Uncertainty](https://groww.in/blog/how-to-trade-options-in-times-of-wars)[Om Power Transmission IPO Day 1: Check GMP, Subscription Status & Key Highlights](https://groww.in/blog/om-power-transmission-ipo-day-1)
Related Posts
[What Are Technical Indicators?](https://groww.in/blog/technical-indicators)[Channels in Technical Analysis](https://groww.in/blog/channels-in-technical-analysis)[Fundamental Trading: A Beginner’s Guide to Stock Market Analysis](https://groww.in/blog/fundamental-trading)[What is Positional Trading?](https://groww.in/blog/positional-trading) [Definition of Swing Trading](https://groww.in/blog/swing-trading)[Day Trader Introduction](https://groww.in/blog/day-trader)[What is Historic Pricing?](https://groww.in/blog/historic-pricing)
All Topics
[Home](https://groww.in/)\>[Blog](https://groww.in/blog)\>[FnO](https://groww.in/blog/category/fno)\>What Are Bollinger Bands? Meaning, Formula & Trading Strategy
Vaishnavi Tech Park, South Tower, 3rd FloorSarjapur Main Road, Bellandur, Bengaluru – 560103Karnataka
[Contact Us](https://groww.in/help/my-account/searchable/how-to-call-groww-customer-care)
Download the App
GROWW
[About Us](https://groww.in/about-us)[Pricing](https://groww.in/pricing)[Blog](https://groww.in/blog)[Media & Press](https://groww.in/press)[Careers](https://groww.in/careers)[Help & Support](https://groww.in/help)[Trust & Safety](https://groww.in/trust-and-safety)[Investor Relations](https://groww.in/investor-relations)
PRODUCTS
[Stocks](https://groww.in/stocks)[F\&O](https://groww.in/futures-and-options)[MTF](https://groww.in/stocks/mtf)[ETF](https://groww.in/invest-in-etfs)[IPO](https://groww.in/ipo)[Mutual Funds](https://groww.in/mutual-funds)[Commodities](https://groww.in/commodities)[Groww Terminal](https://groww.in/charts)[915 Terminal](https://915.groww.in/)[Stock Screens](https://groww.in/stocks/screens)[Algo Trading](https://groww.in/trade-api)[Groww Charts](https://groww.in/groww-charts)[Groww Digest](https://groww.in/digest)[Demat Account](https://groww.in/open-demat-account)[Groww AMC](https://groww.in/mutual-funds/amc)[PMS](https://groww.in/pms)
© 2016-2026 Groww. All rights reserved.Version: 7.4.9
Share Market
Indices
F\&O
Mutual Funds
ETFs
Funds By Groww
Calculators
IPO
Miscellaneous
[Top Gainers Stocks](https://groww.in/markets/top-gainers)[52 Weeks High Stocks](https://groww.in/markets/52-week-high)[Tata Motors](https://groww.in/stocks/tata-motors-ltd)[NHPC](https://groww.in/stocks/nhpc-ltd)[ITC](https://groww.in/stocks/itc-ltd)[Wipro](https://groww.in/stocks/wipro-ltd)[BSE](https://groww.in/stocks/bse-ltd)[NTPC](https://groww.in/stocks/ntpc-green-energy-ltd)
[Top Losers Stocks](https://groww.in/markets/top-losers)[52 Weeks Low Stocks](https://groww.in/markets/52-week-low)[IREDA](https://groww.in/stocks/indian-renewable-energy-development-agency-ltd-1569588972606)[State Bank of India](https://groww.in/stocks/state-bank-of-india)[Adani Power](https://groww.in/stocks/adani-power-ltd)[CDSL](https://groww.in/stocks/central-depository-services-india-ltd)[Cochin Shipyard](https://groww.in/stocks/cochin-shipyard-ltd)[SJVN](https://groww.in/stocks/sjvn-ltd)
[Most Traded Stocks](https://groww.in/stocks/most-bought-stocks-on-groww)[Stocks Market Calender](https://groww.in/stocks/calendar)[Tata Steel](https://groww.in/stocks/tata-steel-ltd)[Tata Power](https://groww.in/stocks/tata-power-company-ltd)[Bharat Heavy Electricals](https://groww.in/stocks/bharat-heavy-electricals-ltd)[Indian Oil Corporation](https://groww.in/stocks/indian-oil-corporation-ltd)[HUDCO](https://groww.in/stocks/housing-urban-development-corporation-ltd)[SAIL](https://groww.in/stocks/steel-authority-of-india-ltd)
[Stocks Feed](https://groww.in/stock-feed)[Suzlon Energy](https://groww.in/stocks/suzlon-energy-ltd)[Zomato (Eternal)](https://groww.in/stocks/zomato-ltd)[Yes Bank](https://groww.in/stocks/yes-bank-ltd)[Infosys](https://groww.in/stocks/infosys-ltd)[NBCC](https://groww.in/stocks/nbcc-india-ltd)[IRCTC](https://groww.in/stocks/indian-railway-catering-tourism-corpn-ltd)[Share Market Live Update](https://groww.in/share-market-today)
[FII DII Activity](https://groww.in/fii-dii-data)[IRFC](https://groww.in/stocks/indian-railway-finance-corporation-ltd)[Bharat Electronics](https://groww.in/stocks/bharat-electronics-ltd)[HDFC Bank](https://groww.in/stocks/hdfc-bank-ltd)[Vedanta](https://groww.in/stocks/vedanta-ltd)[Reliance Power](https://groww.in/stocks/reliance-power-ltd)[Jaiprakash Power Ventures](https://groww.in/stocks/jaiprakash-power-ventures-ltd)[Stocks Sectors](https://groww.in/stocks/sectors)
[NIFTY 50](https://groww.in/indices/nifty)[NIFTY Midcap 100](https://groww.in/indices/nifty-midcap)[NIFTY 100](https://groww.in/indices/nifty-218500)[US Tech 100](https://groww.in/indices/global-indices/nasdaq)[NIFTY Realty](https://groww.in/indices/nifty-realty)[Nikkei index](https://groww.in/indices/global-indices/nikkei)
[SENSEX](https://groww.in/indices/sp-bse-sensex)[NIFTY Smallcap 100](https://groww.in/indices/nifty-smallcap-100)[NIFTY Auto](https://groww.in/indices/nifty-auto)[Dow Jones Futures](https://groww.in/indices/global-indices/dow-jones-futures)[NIFTY PSU Bank](https://groww.in/indices/nifty-psu-bank)[NIFTY FMCG](https://groww.in/indices/nifty-fmcg)
[NIFTY BANK](https://groww.in/indices/nifty-bank)[NIFTY MIDCAP 150](https://groww.in/indices/nifty-midcap-150)[KOSPI Index](https://groww.in/indices/global-indices/kospi)[Dow Jones Index](https://groww.in/indices/global-indices/dow-jones)[Gift Nifty](https://groww.in/indices/global-indices/sgx-nifty)[BSE BANKEX](https://groww.in/indices/sp-bse-bankex)
[India VIX](https://groww.in/indices/india-vix)[NIFTY Pharma](https://groww.in/indices/nifty-pharma)[HANG SENG Index](https://groww.in/indices/global-indices/hang-seng)[BSE 100](https://groww.in/indices/bse-100)[FTSE 100 Index](https://groww.in/indices/global-indices/ftse)[S\&P 500](https://groww.in/indices/global-indices/sp-500)
[NIFTY NEXT 50](https://groww.in/indices/nifty-next)[NIFTY Metal](https://groww.in/indices/nifty-metal)[DAX Index](https://groww.in/indices/global-indices/dax)[NIFTY Fin Service](https://groww.in/indices/nifty-financial-services)[CAC Index](https://groww.in/indices/global-indices/cac)[Nifty Pvt Bank](https://groww.in/indices/nifty-pvt-bank)
[NIFTY Bank Options](https://groww.in/options/nifty-bank)[SBI Options](https://groww.in/options/state-bank-of-india)[Bajaj Finance Options](https://groww.in/options/bajaj-finance-ltd)[Axis Bank Options](https://groww.in/options/axis-bank-ltd)[Hindustan Unilever Options](https://groww.in/options/hindustan-unilever-ltd)[NIFTY Bank Futures](https://groww.in/futures/nifty-bank)[Finnifty Futures](https://groww.in/futures/nifty-financial-services)[ITC Futures](https://groww.in/futures/itc-ltd)[ICICI Bank Futures](https://groww.in/futures/icici-bank-ltd)[Biocon Futures](https://groww.in/futures/biocon-ltd)[Indusind Bank Futures](https://groww.in/futures/indusind-bank-ltd)[Crude Oil Mini Future Price](https://groww.in/commodities/futures/mcx_crudeoilm)[Gold Petal Future Price](https://groww.in/commodities/futures/mcx_goldpetal)[Silver Micro Future Price](https://groww.in/commodities/futures/mcx_silvermic)[Nickel Future Price](https://groww.in/commodities/futures/mcx_nickel)[Natural Gas Mini MCX Option Chain](https://groww.in/commodities/options/mcx_natgasmini)[Copper MCX Option Chain](https://groww.in/commodities/options/mcx_copper)
[NIFTY 50 Options](https://groww.in/options/nifty)[HDFC Bank Options](https://groww.in/options/hdfc-bank-ltd)[Wipro Options](https://groww.in/options/wipro-ltd)[DLF Options](https://groww.in/options/dlf-ltd)[REC Options](https://groww.in/options/rec-ltd)[Yes Bank Futures](https://groww.in/futures/yes-bank-ltd)[Zomato Futures](https://groww.in/futures/zomato-ltd)[Ashok Leyland Futures](https://groww.in/futures/ashok-leyland-ltd)[HDFC Bank Futures](https://groww.in/futures/hdfc-bank-ltd)[UPL Futures](https://groww.in/futures/upl-ltd)[Adani Enterprises Futures](https://groww.in/futures/adani-enterprises-ltd)[Gold Future Price](https://groww.in/commodities/futures/mcx_gold)[Natural Gas Future Price](https://groww.in/commodities/futures/mcx_naturalgas)[Zinc Future Price](https://groww.in/commodities/futures/mcx_zinc)[Gold MCX Option Chain](https://groww.in/commodities/options/mcx_gold)[Gold Mini MCX Option Chain](https://groww.in/commodities/options/mcx_goldm)
[Bse Sensex Options](https://groww.in/options/sp-bse-sensex)[Tata Steel Options](https://groww.in/options/tata-steel-ltd)[NTPC Options](https://groww.in/options/ntpc-ltd)[Bajaj Auto Options](https://groww.in/options/bajaj-auto-ltd)[Indusind Bank Options](https://groww.in/options/indusind-bank-ltd)[Tata Motors Futures](https://groww.in/futures/tata-motors-ltd)[Infosys Futures](https://groww.in/futures/infosys-ltd)[Asian Paints Futures](https://groww.in/futures/asian-paints-ltd)[Lupin Futures](https://groww.in/futures/lupin-ltd)[Cipla Futures](https://groww.in/futures/cipla-ltd)[IDFC First Bank Futures](https://groww.in/futures/idfc-bank-ltd)[Gold Mini Future Price](https://groww.in/commodities/futures/mcx_goldm)[Natural Gas Mini Future Price](https://groww.in/commodities/futures/mcx_natgasmini)[Copper Future Price](https://groww.in/commodities/futures/mcx_copper)[Crude Oil MCX Option Chain](https://groww.in/commodities/options/mcx_crudeoil)[Silver MCX Option Chain](https://groww.in/commodities/options/mcx_silver)
[Finnifty Options](https://groww.in/options/nifty-financial-services)[Infosys Options](https://groww.in/options/infosys-ltd)[Asian Paints Options](https://groww.in/options/asian-paints-ltd)[Coal India Options](https://groww.in/options/coal-india-ltd)[Ashok Leyland Options](https://groww.in/options/ashok-leyland-ltd)[Tata Steel Futures](https://groww.in/futures/tata-steel-ltd)[BSE Sensex Futures](https://groww.in/futures/sp-bse-sensex)[Wipro Futures](https://groww.in/futures/wipro-ltd)[DLF Futures](https://groww.in/futures/dlf-ltd)[Bajaj Finance Futures](https://groww.in/futures/bajaj-finance-ltd)[Piramal Enterprises Futures](https://groww.in/futures/piramal-enterprises-ltd)[Gold Ten Future Price](https://groww.in/commodities/futures/mcx_goldten)[Silver Future Price](https://groww.in/commodities/futures/mcx_silver)[Aluminium Future Price](https://groww.in/commodities/futures/mcx_aluminium)[Crude Oil Mini MCX Option Chain](https://groww.in/commodities/options/mcx_crudeoilm)[Silver Mini MCX Option Chain](https://groww.in/commodities/options/mcx_silverm)
[Tata Motors Options](https://groww.in/options/tata-motors-ltd)[ITC Options](https://groww.in/options/itc-ltd)[ICICI Bank Options](https://groww.in/options/icici-bank-ltd)[Adani Enterprises Options](https://groww.in/options/adani-enterprises-ltd)[NIFTY 50 Futures](https://groww.in/futures/nifty)[Coal India Futures](https://groww.in/futures/coal-india-ltd)[Axis Bank Futures](https://groww.in/futures/axis-bank-ltd)[Vedanta Futures](https://groww.in/futures/vedanta-ltd)[Reliance Industries Futures](https://groww.in/futures/reliance-industries-ltd)[Hindustan Copper Futures](https://groww.in/futures/hindustan-copper-ltd)[Crude Oil Future Price](https://groww.in/commodities/futures/mcx_crudeoil)[Gold Guinea Future Price](https://groww.in/commodities/futures/mcx_goldguinea)[Silver Mini Future Price](https://groww.in/commodities/futures/mcx_silverm)[Electricity Future Price](https://groww.in/commodities/futures/mcx_elecdmbl)[Natural Gas MCX Option Chain](https://groww.in/commodities/options/mcx_naturalgas)[Zinc MCX Option Chain](https://groww.in/commodities/options/mcx_zinc)
[MF Screener](https://groww.in/mutual-funds/filter)[Debt Mutual Funds](https://groww.in/mutual-funds/debt-funds)[Best Multicap Mutual funds](https://groww.in/mutual-funds/category/best-multi-cap-mutual-funds)[Best Contra Mutual funds](https://groww.in/mutual-funds/category/best-contra-mutual-funds)[Best Conservative Mutual funds](https://groww.in/mutual-funds/category/best-conservative-mutual-funds)[SBI Contra Fund](https://groww.in/mutual-funds/sbi-contra-fund-direct-growth)[Nippon India Nifty 500 Momentum 50 Index Fund](https://groww.in/mutual-funds/nippon-india-nifty-500-momentum-50-index-fund-direct-growth)[HDFC Balanced Advantage Fund](https://groww.in/mutual-funds/hdfc-balanced-advantage-fund-direct-growth)[Quant Mid Cap Fund](https://groww.in/mutual-funds/quant-mid-cap-fund-direct-growth)[Bank of India Small Cap Fund](https://groww.in/mutual-funds/bank-of-india-small-cap-fund-direct-growth)[Quant Multi Asset Fund](https://groww.in/mutual-funds/quant-multi-asset-fund-direct-growth)[Nippon India](https://groww.in/mutual-funds/amc/nippon-india-mutual-funds)[TATA](https://groww.in/mutual-funds/amc/tata-mutual-funds)[Bandhan](https://groww.in/mutual-funds/amc/bandhan-mutual-funds)[Edelweiss](https://groww.in/mutual-funds/amc/edelweiss-mutual-funds)[HSBC](https://groww.in/mutual-funds/amc/hsbc-mutual-funds)[Union](https://groww.in/mutual-funds/amc/union-mutual-funds)[Quantum](https://groww.in/mutual-funds/amc/quantum-mutual-funds)[Shriram](https://groww.in/mutual-funds/amc/shriram-mutual-funds)
[Compare Mutual Funds](https://groww.in/mutual-funds/compare)[Best Debt Mutual funds](https://groww.in/mutual-funds/category/best-debt-mutual-funds)[Best Large Cap Mutual funds](https://groww.in/mutual-funds/category/best-large-cap-mutual-funds)[Best Value Mutual funds](https://groww.in/mutual-funds/category/best-value-mutual-funds)[Parag Parikh Flexi Cap Fund](https://groww.in/mutual-funds/parag-parikh-long-term-value-fund-direct-growth)[HDFC Mid Cap Opportunities Fund](https://groww.in/mutual-funds/hdfc-mid-cap-opportunities-fund-direct-growth)[Motilal Oswal Nifty India Defence Index Fund](https://groww.in/mutual-funds/motilal-oswal-nifty-india-defence-index-fund-direct-growth)[ICICI Prudential India Opportunities Fund](https://groww.in/mutual-funds/icici-prudential-india-opportunities-fund-direct-growth)[Kotak Small Cap Fund](https://groww.in/mutual-funds/kotak-midcap-fund-direct-growth)[Canara Robeco Bluechip Equity Fund](https://groww.in/mutual-funds/canara-robeco-large-cap-fund-direct-growth)[GrowwMF](https://groww.in/mutual-funds/amc/groww-mutual-funds)[Motilal Oswal](https://groww.in/mutual-funds/amc/motilal-oswal-mutual-funds)[Aditya Birla](https://groww.in/mutual-funds/amc/aditya-birla-sun-life-mutual-funds)[Axis](https://groww.in/mutual-funds/amc/axis-mutual-funds)[Bank of India](https://groww.in/mutual-funds/amc/bank-of-india-mutual-funds)[Bajaj Finserv](https://groww.in/mutual-funds/amc/bajaj-finserv-mutual-funds)[Helios](https://groww.in/mutual-funds/amc/helios-mutual-funds)[ITI](https://groww.in/mutual-funds/amc/iti-mutual-funds)[Trust](https://groww.in/mutual-funds/amc/trust-mutual-funds)
[MF Knowledge Centre](https://groww.in/blog/category/mutual-funds)[Best Equity Mutual funds](https://groww.in/mutual-funds/category/best-equity-mutual-funds)[Best Small Cap Mutual funds](https://groww.in/mutual-funds/category/best-small-cap-mutual-funds)[Best Arbitrage Mutual funds](https://groww.in/mutual-funds/category/best-arbitrage-mutual-funds)[Motilal Oswal Midcap Fund](https://groww.in/mutual-funds/motilal-oswal-most-focused-midcap-30-fund-direct-growth)[SBI Small Cap Fund](https://groww.in/mutual-funds/sbi-small-midcap-fund-direct-growth)[HDFC Small Cap Fund](https://groww.in/mutual-funds/hdfc-small-cap-fund-direct-growth)[Kotak Multicap Fund](https://groww.in/mutual-funds/kotak-multicap-fund-direct-growth)[ICICI Prudential Infrastructure Fund](https://groww.in/mutual-funds/icici-prudential-infrastructure-fund-direct-growth)[Bandhan Nifty Alpha 50 Index Fund](https://groww.in/mutual-funds/bandhan-nifty-alpha-50-index-fund-direct-growth)[SBI](https://groww.in/mutual-funds/amc/sbi-mutual-funds)[Quant](https://groww.in/mutual-funds/amc/quant-mutual-funds)[Mirae Asset](https://groww.in/mutual-funds/amc/mirae-asset-mutual-funds)[DSP](https://groww.in/mutual-funds/amc/dsp-mutual-funds)[Baroda BNP Paribas](https://groww.in/mutual-funds/amc/baroda-bnp-paribas-mutual-funds)[Mahindra Manulife](https://groww.in/mutual-funds/amc/mahindra-manulife-mutual-funds)[Sundaram](https://groww.in/mutual-funds/amc/sundaram-mutual-funds)[Samco](https://groww.in/mutual-funds/amc/samco-mutual-funds)[Taurus](https://groww.in/mutual-funds/amc/taurus-mutual-funds)
[Mutual Fund Houses](https://groww.in/mutual-funds/amc)[Best Hybrid Mutual funds](https://groww.in/mutual-funds/category/best-hybrid-mutual-funds)[Best ELSS Mutual funds](https://groww.in/mutual-funds/category/best-elss-mutual-funds)[Best Dividend Yield Mutual funds](https://groww.in/mutual-funds/category/best-dividend-yield-mutual-funds)[Nippon India Small Cap Fund](https://groww.in/mutual-funds/nippon-india-small-cap-fund-direct-growth)[HDFC Flexi Cap Fund](https://groww.in/mutual-funds/hdfc-equity-fund-direct-growth)[Tata Small Cap Fund](https://groww.in/mutual-funds/tata-small-cap-fund-direct-growth)[Tata Ethical Fund](https://groww.in/mutual-funds/tata-ethical-fund-direct-growth)[Mirae Asset ELSS Tax Saver Fund](https://groww.in/mutual-funds/mirae-asset-elss-tax-saver-fund-direct-growth)[Quant Infrastructure Fund](https://groww.in/mutual-funds/quant-infrastructure-fund-direct-growth)[HDFC](https://groww.in/mutual-funds/amc/hdfc-mutual-funds)[PPFAS](https://groww.in/mutual-funds/amc/ppfas-mutual-funds)[UTI](https://groww.in/mutual-funds/amc/uti-mutual-funds)[Kotak Mahindra](https://groww.in/mutual-funds/amc/kotak-mahindra-mutual-funds)[Zerodha](https://groww.in/mutual-funds/amc/zerodha-mutual-funds)[Invesco](https://groww.in/mutual-funds/amc/invesco-mutual-funds)[Navi](https://groww.in/mutual-funds/amc/navi-mutual-funds)[PGIM](https://groww.in/mutual-funds/amc/pgim-india-mutual-funds)
[Mutual Funds Categories](https://groww.in/mutual-funds/category)[Best MidCap Mutual funds](https://groww.in/mutual-funds/category/best-mid-cap-mutual-funds)[Best Sector Mutual funds](https://groww.in/mutual-funds/category/best-sector-mutual-funds)[Best Aggressive Mutual funds](https://groww.in/mutual-funds/category/best-aggressive-mutual-funds)[Quant Small Cap Fund](https://groww.in/mutual-funds/quant-small-cap-fund-direct-plan-growth)[SBI Magnum Children's Benefit Fund](https://groww.in/mutual-funds/sbi-magnum-children-benefit-plan-direct)[UTI Nifty 50 Index Fund](https://groww.in/mutual-funds/uti-nifty-fund-direct-growth)[JM Flexicap Fund](https://groww.in/mutual-funds/jm-multi-strategy-fund-direct-growth)[HSBC Small Cap Fund](https://groww.in/mutual-funds/hsbc-small-cap-fund-direct-growth)[Franklin India Multi Cap Fund](https://groww.in/mutual-funds/franklin-india-multi-cap-fund-direct-growth)[ICICI Prudential](https://groww.in/mutual-funds/amc/icici-prudential-mutual-funds)[LIC](https://groww.in/mutual-funds/amc/lic-mutual-funds)[Canara Robeco](https://groww.in/mutual-funds/amc/canara-robeco-mutual-funds)[Whiteoak](https://groww.in/mutual-funds/amc/whiteoak-capital-mutual-funds)[Franklin Templeton](https://groww.in/mutual-funds/amc/franklin-templeton-mutual-funds)[NJ](https://groww.in/mutual-funds/amc/nj-mutual-funds)[JM](https://groww.in/mutual-funds/amc/jm-financial-mutual-funds)[360 One](https://groww.in/mutual-funds/amc/360-one-mutual-funds)
[International](https://groww.in/etfs/international)[Silver](https://groww.in/etfs/silver)[Midcap](https://groww.in/etfs/midcap)[Liquid](https://groww.in/etfs/liquid)
[Debt](https://groww.in/etfs/debt)[Index](https://groww.in/etfs/indices)[Bank Nifty](https://groww.in/etfs/bank-nifty)[Nifty IT](https://groww.in/etfs/nifty-it)
[Equity](https://groww.in/etfs/equity)[Nifty 50](https://groww.in/etfs/nifty-50)[Nifty Metal](https://groww.in/etfs/nifty-metal)[Nifty Auto](https://groww.in/etfs/nifty-auto)
[Commodity](https://groww.in/etfs/commodities)[Nifty Next 50](https://groww.in/etfs/nifty-next-50)[Healthcare](https://groww.in/etfs/healthcare)[Groww](https://groww.in/etfs/groww-etfs)
[Gold](https://groww.in/etfs/gold)[Sensex](https://groww.in/etfs/sensex)[Defence](https://groww.in/etfs/defence)
[Groww Arbitrage Fund](https://groww.in/mutual-funds/groww-arbitrage-fund-direct-growth)[Groww ELSS Tax Saver Fund](https://groww.in/mutual-funds/groww-elss-tax-saver-fund-direct-growth)[Groww Banking & Financial Services Fund](https://groww.in/mutual-funds/groww-banking-financial-services-fund-direct-growth)[Groww Gold ETF FOF](https://groww.in/mutual-funds/groww-gold-etf-fof-direct-growth)[Groww Gold ETF](https://groww.in/etfs/groww-gold-etf)
[Groww Short Duration Fund](https://groww.in/mutual-funds/groww-short-duration-fund-direct-growth)[Groww Aggressive Hybrid Fund](https://groww.in/mutual-funds/groww-aggressive-hybrid-fund-direct-growth)[Groww Nifty Smallcap 250 Index Fund](https://groww.in/mutual-funds/groww-nifty-smallcap-250-index-fund-direct-growth)[Groww Multicap Fund](https://groww.in/mutual-funds/groww-multicap-fund-direct-growth)[Groww Nifty India Defence ETF](https://groww.in/etfs/groww-nifty-india-defence-etf)
[Groww Liquid Fund](https://groww.in/mutual-funds/groww-liquid-fund-direct-growth)[Groww Dynamic Bond Fund](https://groww.in/mutual-funds/groww-dynamic-bond-fund-direct-growth)[Groww Nifty Non Cyclical Consumer Index Fund](https://groww.in/mutual-funds/groww-nifty-non-cyclical-consumer-index-fund-direct-growth)[Groww Nifty India Railways PSU Index Fund](https://groww.in/mutual-funds/groww-nifty-india-railways-psu-index-fund-direct-growth)[Groww Nifty India Railways ETF](https://groww.in/etfs/groww-nifty-india-railways-psu-etf)
[Groww Large Cap Fund](https://groww.in/mutual-funds/groww-large-cap-fund-direct-growth)[Groww Overnight Fund](https://groww.in/mutual-funds/groww-overnight-fund-direct-growth)[Groww Nifty EV & New Age Automotive ETF FoF](https://groww.in/mutual-funds/groww-nifty-ev-new-age-automotive-etf-fof-direct-growth)[Groww Nifty 200 ETF FoF](https://groww.in/mutual-funds/groww-nifty-200-etf-fof-direct-growth)
[Groww Value Fund](https://groww.in/mutual-funds/groww-value-fund-direct-growth)[Groww Nifty Total Market Index Fund](https://groww.in/mutual-funds/groww-nifty-total-market-index-fund-direct-growth)[Groww Nifty India Defence ETF FoF](https://groww.in/mutual-funds/groww-nifty-india-defence-etf-fof-direct-growth)[Groww Silver ETF](https://groww.in/etfs/groww-silver-etf)
[SIP Calculator](https://groww.in/calculators/sip-calculator)[Brokerage Calculator](https://groww.in/calculators/brokerage-calculator)[RD Calculator](https://groww.in/calculators/rd-calculator)[HRA Calculator](https://groww.in/calculators/hra-calculator)[Home Loan EMI Calculator](https://groww.in/calculators/home-loan-emi-calculator)
[Lumpsum Calculator](https://groww.in/calculators/lumpsum-calculator)[Margin Calculator](https://groww.in/calculators/margin-calculator)[FD Calculator](https://groww.in/calculators/fd-calculator)[Salary Calculator](https://groww.in/calculators/salary-calculator)[ROI Calculator](https://groww.in/calculators/roi-calculator)
[SWP Calculator](https://groww.in/calculators/swp-calculator)[Stock Average Calculator](https://groww.in/calculators/stock-average-calculator)[EPF Calculator](https://groww.in/calculators/epf-calculator)[TDS Calculator](https://groww.in/calculators/tds-calculator)
[MF Calculator](https://groww.in/calculators/mutual-fund-returns-calculator)[SSY Calculator](https://groww.in/calculators/sukanya-samriddhi-yojana-calculator)[Income Tax Calculator](https://groww.in/calculators/income-tax-calculator)[EMI Calculator](https://groww.in/calculators/emi-calculator)
[Step-Up SIP Calculator](https://groww.in/calculators/step-up-sip-calculator)[PPF Calculator](https://groww.in/calculators/ppf-calculator)[GST Calculator](https://groww.in/calculators/gst-calculator)[Car Loan EMI Calculator](https://groww.in/calculators/car-loan-emi-calculator)
[What is IPO?](https://groww.in/p/what-is-ipo)[IPO Subscription Status](https://groww.in/ipo/subscription)[IPO Allotment Status](https://groww.in/ipo/allotment)
[Open IPOs](https://groww.in/ipo)[How to Apply for an IPO](https://groww.in/blog/how-to-invest-in-an-ipo-online)
[Upcoming IPOs](https://groww.in/ipo/upcoming)[What is Grey Market Premium?](https://groww.in/p/what-is-grey-market)
[Closed IPOs](https://groww.in/ipo/closed)[Mainboard IPOs](https://groww.in/ipo/mainboard)
[IPO GMP](https://groww.in/ipo/gmp)[SME IPOs](https://groww.in/ipo/sme)
[NFO](https://groww.in/nfo)[Pricing](https://groww.in/pricing)[Trust & Safety](https://groww.in/trust-and-safety)[Fixed Deposit](https://groww.in/fixed-deposits/fd-interest-rates)
[Intraday](https://groww.in/stocks/intraday)[Blog](https://groww.in/blog)[Investor Relations](https://groww.in/investor-relations)[Recurring Deposit](https://groww.in/recurring-deposit/rd-interest-rates)
[Corporate Bonds](https://groww.in/corporate-bonds/ipo)[Media & Press](https://groww.in/press)[Gold Rates](https://groww.in/gold-rates)[Groww Digest](https://groww.in/digest)
[HUF Demat Account](https://groww.in/open-huf-demat-account)[Careers](https://groww.in/careers)[Silver Rates](https://groww.in/silver-rates)[Invest in Gold](https://groww.in/gold)
[About Us](https://groww.in/about-us)[Help & Support](https://groww.in/help)[Glossary](https://groww.in/p)[Sitemap](https://groww.in/sitemap)
Show More
Others:
[NSE](https://www.nseindia.com/)[BSE](https://www.bseindia.com/)[MCX](https://www.mcxindia.com/)[Terms and Conditions](https://groww.in/terms-and-conditions/)[Policies and Procedures](https://groww.in/p/policies/)[Regulatory & Other Info](https://groww.in/regulatory-and-other-information)[Privacy Policy](https://groww.in/privacy-policy/)[Disclosure](https://groww.in/p/disclosure/)[SMART ODR](https://smartodr.in/)[Download Forms](https://groww.in/download-forms)[Information Security Practices](https://groww.in/p/security)[Investor Charter and Grievance](https://groww.in/investor-charters-and-grievance)[Bug Bounty](https://security.groww.in/)
Mutual Funds:
[A](https://groww.in/mutual-funds/fund-list/a)[B](https://groww.in/mutual-funds/fund-list/b)[C](https://groww.in/mutual-funds/fund-list/c)[D](https://groww.in/mutual-funds/fund-list/d)[E](https://groww.in/mutual-funds/fund-list/e)[F](https://groww.in/mutual-funds/fund-list/f)[G](https://groww.in/mutual-funds/fund-list/g)[H](https://groww.in/mutual-funds/fund-list/h)[I](https://groww.in/mutual-funds/fund-list/i)[J](https://groww.in/mutual-funds/fund-list/j)[K](https://groww.in/mutual-funds/fund-list/k)[L](https://groww.in/mutual-funds/fund-list/l)[M](https://groww.in/mutual-funds/fund-list/m)[N](https://groww.in/mutual-funds/fund-list/n)[O](https://groww.in/mutual-funds/fund-list/o)[P](https://groww.in/mutual-funds/fund-list/p)[Q](https://groww.in/mutual-funds/fund-list/q)[R](https://groww.in/mutual-funds/fund-list/r)[S](https://groww.in/mutual-funds/fund-list/s)[T](https://groww.in/mutual-funds/fund-list/t)[U](https://groww.in/mutual-funds/fund-list/u)[V](https://groww.in/mutual-funds/fund-list/v)[W](https://groww.in/mutual-funds/fund-list/w)[X](https://groww.in/mutual-funds/fund-list/x)[Y](https://groww.in/mutual-funds/fund-list/y)[Z](https://groww.in/mutual-funds/fund-list/z)[Others](https://groww.in/mutual-funds/fund-list/others)
Stocks:
[A](https://groww.in/stocks/stocks-list/a)[B](https://groww.in/stocks/stocks-list/b)[C](https://groww.in/stocks/stocks-list/c)[D](https://groww.in/stocks/stocks-list/d)[E](https://groww.in/stocks/stocks-list/e)[F](https://groww.in/stocks/stocks-list/f)[G](https://groww.in/stocks/stocks-list/g)[H](https://groww.in/stocks/stocks-list/h)[I](https://groww.in/stocks/stocks-list/i)[J](https://groww.in/stocks/stocks-list/j)[K](https://groww.in/stocks/stocks-list/k)[L](https://groww.in/stocks/stocks-list/l)[M](https://groww.in/stocks/stocks-list/m)[N](https://groww.in/stocks/stocks-list/n)[O](https://groww.in/stocks/stocks-list/o)[P](https://groww.in/stocks/stocks-list/p)[Q](https://groww.in/stocks/stocks-list/q)[R](https://groww.in/stocks/stocks-list/r)[S](https://groww.in/stocks/stocks-list/s)[T](https://groww.in/stocks/stocks-list/t)[U](https://groww.in/stocks/stocks-list/u)[V](https://groww.in/stocks/stocks-list/v)[W](https://groww.in/stocks/stocks-list/w)[X](https://groww.in/stocks/stocks-list/x)[Y](https://groww.in/stocks/stocks-list/y)[Z](https://groww.in/stocks/stocks-list/z)[Others](https://groww.in/stocks/stocks-list/others) |
| Readable Markdown | Bollinger Bands are both versatile and one of the most widely used technical indicators in the trading world. Whether you are trading stocks, options, or futures, Bollinger Bands help you visualise price action for volatility, potential breakouts, or reversals defined by solid numbers.
In this guide, we will cover the basics of Bollinger Bands, how to use them, common errors, and real-world trading strategies.
## **Introduction to Bollinger Bands**
Bollinger Bands are a volatility-based technical analysis indicator that consists of three calculation lines:
- A Simple [Moving Average](https://groww.in/p/moving-average-crossover-pattern) (SMA)
- An upper band
- A lower band
The distance between the bands expands or contracts based on market volatility: when volatility is high, the bands expand, and when volatility is low, they narrow. Traders commonly use Bollinger Bands to identify overbought or oversold levels, pattern breakouts, and low-volatility areas that may signal future momentum.
****
## **Who Created Bollinger Bands?**
Bollinger Bands are named after their creator, John Bollinger, who developed them in the 1980s. John utilised a dynamic technical indicator that could adapt to underlying market conditions, rather than the static trading ranges regularly used by traders. Currently, Bollinger Bands are a standard indicator on nearly all trading platforms.
## **How Bollinger Bands Are Calculated**
The calculation of Bollinger Bands is done with a Simple Moving Average or SMA for the middle band and the standard deviations for the lower and upper bands. It is typically done over 20 periods, with the Middle Band being the 20-day SMA and the Upper Band being the SMA plus 2 standard deviations. The Lower Band in this case is the SMA, which is two standard deviations below the price to track price volatility.
Here are the steps for the calculation:
- **Middle Band (SMA):** For the set period (say 20 days), sum the closing prices and then divide them by the number of periods. This will calculate the 20-day Simple Moving Average.
- **Standard Deviation:** Work out the standard deviation for the exact price figures (say 20 days) used for the SMA. This measures the price volatility.
- **Upper Band:** Add the standard deviation (multiplied by the set factor, mostly 2) to the Middle Band. So, it is the Standard Deviation x 2 + Middle Band.
- **Lower Band:** Deduct the standard deviation (multiplied by the same factor, mostly 2) from the Middle Band. So, in this case, it is Middle Band - Standard Deviation x 2.
## **Components of Bollinger Bands**
Here are some of the main components of Bollinger bands.
### **➤ Middle Band (Simple Moving Average)**
- Usually, a 20-period Simple Moving Average (SMA).
- It is primarily helpful for establishing a baseline or trend for the indicator.
### **➤ Upper and Lower Bands (Standard Deviations)**
- Plotted two standard deviations below and above the middle SMA line
- representation of price volatility with st. Dev. indicating volatility: wider bands = high; narrower bands = low
**Formula:**
- Upper Band = SMA + (2 × Standard Deviation)
- Lower Band = SMA - (2 × Standard Deviation)
## **How to Interpret Bollinger Bands**
Bollinger Bands are an effective technical indicator that helps traders visualise price squeezes, low volatility, and gaps, as well as potential trading opportunities. A Bollinger Band is made up of three bands: a central band (the default setting is a 20-period Simple Moving Average), and two outer bands that are two standard deviations away from the central band. Here is how to correctly interpret a Bollinger Band:
- When the bands come together and contract closely, it signals a Bollinger Band squeeze, a sign of low volatility. Typically, this is viewed as a warning to traders that a sharp price movement or breakout is imminent, either up or down. Traders keep a close eye on squeezes because they can quickly develop into a profitable trade setup.
- When price comes in contact with, or breaches, an upper or lower band, it indicates that price is either overbought (upper band) or oversold (lower band). However, it is important to note that just because the price is touching the upper or lower band, it does not mean it is an automatic signal for price reversal; price can and often will continue up or down in the direction of the trend, especially in a strong bullish or bearish market.
- When the price can ride the upper band, it indicates strong bullish momentum. When price consistently trades in the lower band, it should be viewed as bearish momentum.
- Traders use volume to confirm a breakout (or potential reversal). To increase projections, traders often add Bollinger Bands alongside other indicators, such as RSI, MACD, or Moving Average [crossovers](https://groww.in/blog/how-to-use-golden-crossover-strategy).
- In summary, while Bollinger Bands can identify squeezes, breakouts, and overextensions, it is always a good idea to have other confirmation tools to make your profits more reliable\!
## **Trading Strategies Using Bollinger Bands**
Here are some of the trading strategies you can deploy with Bollinger bands.
### **Mean Reversion Strategy**
- Assumes price will revert to the middle band after reaching the upper or lower band
- Ideal for **range-bound or sideways markets**
**Entry:** Buy near the lower band, sell near the upper band
**Stop-loss:** Just outside the bands
**Take profit:** Near the middle band (SMA)
### **Trend Following Strategy**
- Enter trades in the direction of a **confirmed breakout**
- Works best in **strong trending markets**
**Entry:** On breakout with volume confirmation
**Stop-loss:** Inside the band
**Take profit:** Ride the trend, using trailing stops.
For [options](https://groww.in/blog/best-indicators-for-option-trading), Bollinger Bands can pair well with strategies like **straddles or strangles**, especially when anticipating volatility expansion.
## **Common Mistakes to Avoid**
Here are some common errors worth avoiding.
- **Assuming all breakouts are sustainable**: Many of them are false without volume confirmation.
- **Ignoring trend direction:** Bollinger Bands work best when combined with trend analysis.
- **Using fixed settings for all assets:** Adjust the moving average period and standard deviation to suit different instruments or timeframes.
- **Forcing trades in a low-volatility market:** Sometimes, the best trade is no trade.
## **Combining Bollinger Bands with Other Indicators**
To improve accuracy, combine Bollinger Bands with:
- **Moving Average Crossover Patterns**
- **Relative Strength Index (RSI)** to confirm overbought or oversold conditions
- **MACD** to track momentum shifts
- **Golden Crossover Strategy** for long-term trend confirmation (Golden Crossover Strategy)
- **Option Chain and Implied Volatility** to optimise options trades (Option Chain, Implied Volatility in Options)
## **Risk Management & Position Sizing with Bollinger Bands**
When managing risks with Bollinger Bands, use the band width for position sizing: a smaller size for high volatility/wider bands and a larger size for lower volatility/narrower bands. You also have to set stops below the lower band for long trades or above the upper band for shorter trades. Here are some key aspects worth noting in terms of risk management and position sizing:
- **Placing Stop-Loss:** Put stops right outside the bands, i.e. below the lower band for a long trade and above the upper band for a short trade.
- **Volatility-based Position Sizing:** You can adjust the trade size based on the volatility bandwidth. In this case, it equates to smaller positions during wide bands or high volatility, and possibly larger positions during narrow bands or low volatility periods.
- **Dynamic Resistance or Support:** The upper band may be used as resistance, while the lower band can be used as support for any mean-reversion trades. However, being careful about breakouts is necessary in this case.
- **Position Sizing for High Volatility:** For wide bands, lower the position size to restrict possible losses arising from bigger price swings.
- **Position Sizing for Low Volatility:** In the case of narrow bands, it suggests a potential big move. You may take slightly larger positions with tighter stops, or wait until the breakout is confirmed.
- **Considerations:** Ensure your potential reward justifies your overall risk, using the band levels to set targets. Always use Bollinger Bands in conjunction with added indicators, such as the RSI (Relative Strength Index) or the MACD (Moving Average Convergence Divergence).
- **Bollinger Squeeze:** Watch for narrow-band periods that precede volatility. However, strict stops are necessary, since breakouts may eventually be false in such cases. |
| Shard | 51 (laksa) |
| Root Hash | 4039082580173856451 |
| Unparsed URL | in,groww!/blog/bollinger-bands s443 |