ℹ️ Skipped - page is already crawled
| Filter | Status | Condition | Details |
|---|---|---|---|
| HTTP status | PASS | download_http_code = 200 | HTTP 200 |
| Age cutoff | PASS | download_stamp > now() - 6 MONTH | 0 months ago |
| History drop | PASS | isNull(history_drop_reason) | No drop reason |
| Spam/ban | PASS | fh_dont_index != 1 AND ml_spam_score = 0 | ml_spam_score=0 |
| Canonical | PASS | meta_canonical IS NULL OR = '' OR = src_unparsed | Not set |
| Property | Value |
|---|---|
| URL | https://charts.bitbo.io/price/ |
| Last Crawled | 2026-04-10 09:38:19 (23 hours ago) |
| First Indexed | 2023-05-05 10:10:53 (2 years ago) |
| HTTP Status Code | 200 |
| Meta Title | Bitcoin Price History Chart (2009, 2010 to 2026) |
| Meta Description | null |
| Meta Canonical | null |
| Boilerpipe Text | How Much is Bitcoin Worth Today?
Bitcoin is currently worth $71,585.94 as of the time
you loaded this page.
Check
what would have happened if you would have bought Bitcoin.
How Much was 1 Bitcoin Worth in 2009?
In the very early days of Bitcoin, there were no exchanges that look
anything like the offerings today. But there was at least one exchange
established in the first year since Bitcoin's inception.
The BitcoinTalk forum went online in late 2009 and soon enough one regular
proposed the idea of an exchange where people could buy and sell Bitcoins
for fiat currency. Keep in mind that this was when the block reward was 50
BTC and there were very few people mining.
The BitcoinTalk forum member
NewLibertyStandard
set up New Liberty
Standard Exchange, and another forum user -
Sirius
- sent him 5050
BTC in exchange for $5.02 through PayPal. This puts the first recorded price
at which Bitcoin exchanged hands at $0.00099/BTC.
How Much was 1 Bitcoin Worth in 2010?
Bitcoin's price never topped $1 in 2010! Its highest price for the year was
just $0.39!
2010 is the year in which the famous purchase of two Dominos pizzas for
10,000 BTC took place.
BitcoinTalk forum member
laszlo
offered the following trade:
I'll pay 10,000 bitcoins for a couple of pizzas.. like maybe 2 large ones
so I have some left over for the next day. I like having left over pizza
to nibble on later. You can make the pizza yourself and bring it to my
house or order it for me from a delivery place, but what I'm aiming for is
getting food delivered in exchange for bitcoins where I don't have to
order or prepare it myself, kind of like ordering a 'breakfast platter' at
a hotel or something, they just bring you something to eat and you're
happy!
I like things like onions, peppers, sausage, mushrooms, tomatoes,
pepperoni, etc.. just standard stuff no weird fish topping or anything
like that. I also like regular cheese pizzas which may be cheaper to
prepare or otherwise acquire.
If you're interested please let me know and we can work out a deal.
Thanks,
Laszlo
BitcoinTalk Forum
(1)
2010 also saw the opening of the infamous Bitcoin exchange
Mt. Gox in July.
How Much was 1 Bitcoin Worth in 2011?
Bitcoin Price during 2011
Bitcoin's adoption started to pick up steam in 2011. The Electronic Frontier
Foundation (EFF) accepted Bitcoins as donations for a couple of months in
2011. Due to lack of legal precedent surrounding virtual currencies this
arrangement was quickly rescinded, though this was later reversed in 2013
when the EFF began accepting Bitcoin again.
On February 9th, 2011, BTC reached a value of USD$1.00 for the first time
ever. A few months later, in June, the price of one Bitcoin hit $10, then
$30 on Mt. Gox. This represented a 100x appreciation since the beginning of
the year, when the price of Bitcoin hovered around $0.30.
By the end of the year Bitcoin was trading just under $5, but at least two
important psychological barriers had been broken.
How Much was 1 Bitcoin Worth in 2012?
Bitcoin Price during 2012
Bitcoin had a relatively flat 2012, trading within a $0.50 range of $5.00 for the first half of the year.
It then reached its yearly peak at the end of December, hitting a high of
$13.45.
In November 2012, Bitcoin underwent its first ever
halving
. This dropped the
block reward from 50 BTC to 25 BTC.
2012 also saw the creation of the influential Bitcoin Foundation by Gavin
Andresen, Jon Matonis, Patrick Murck, Charlie Shrem, and Peter Vessenes. The
Foundation's goal is to "accelerate the global growth of Bitcoin through
standardization, protection, and promotion of the open source protocol".
Wordpress became the first major company to begin in 2012
(2)
. The online content management system provider did this in response
to PayPal's censorship.
PayPal alone blocks access from over 60 countries, and many credit card
companies have similar restrictions. Some are blocked for political
reasons, some because of higher fraud rates, and some for other financial
reasons. Whatever the reason, we don't think an individual blogger from
Haiti, Ethiopia, or Kenya should have diminished access to the blogosphere
because of payment issues they can't control. Our goal is to enable
people, not block them.
Wordpress
(3)
Though Wordpress's move was a big one for the four year-old cryptocurrency,
the company wasn't handling Bitcoin transactions itself. Rather, it used
BitPay, which was founded in 2011 and by October 2012 had grown to
processing Bitcoin payments for more than 1,000 merchants.
How Much was 1 Bitcoin Worth in 2013?
Bitcoin Price during 2013
2013 saw the first major spike in the price of Bitcoin since 2011. From
$13.00 at the beginning of the year, Bitcoin hit nearly $250 in April. It
then cooled off for a while, before experiencing another rapid appreciation
to over $1,100 in December of that year.
Bitcoin punched through $100 easily, though $1,000 proved to be a tougher
psychological resistance level. Despite reaching prices that early
Bitcoiners had only ever dreamed about, it took more than three years for
the price to reach $1,000 again. The drawdown reached -85% at its bottom and
the price of Bitcoin was relatively flat for years.
Bitcoin's record-breaking run pushed the cryptocurrency's market
capitalization over $1 billion for the first time ever. It also attracted a
lot of attention. In February of 2013, Coinbase reported selling more than
$1 million worth of Bitcoin at an average price of $22.
The world's first
Bitcoin ATM
was installed in Vancouver, allowing people to turn their cash into crypto.
The internet's first cryptocurrency also gained some notoriety after the
People's Bank of China prohibited Chinese financial institutions from
transacting in Bitcoins. This came in December 2013 and led to the shutdown
of BTC China - at that time the world's largest Bitcoin exchanges - and a
sudden drop in price.
How Much was 1 Bitcoin Worth in 2014?
Bitcoin Price during 2014
2014 got off to a good start, but things quickly turned sour for Bitcoin.
Just one month after it closed, BTC China reopened for trading and Chinese
Yuan deposits in January 2014.
However, in February Mt. Gox – still one of the
largest and most important crypto exchanges – suspended withdrawals. Users
had been reporting issues with withdrawals for months, but the exchange
called it quits once and for all and filed for bankruptcy. It also reported
that it had lost 744,000 BTC of user funds.
The price of Bitcoin reacted by selling off more than 55% from the beginning
of February to April.
Despite the bear market, a number of big companies announced their support
for Bitcoin. Overstock.com began accepting Bitcoin for all purchases on its
website, as did Microsoft in the Xbox and Windows stores.
How Much was 1 Bitcoin Worth in 2015?
Bitcoin Price during 2015
The price of Bitcoin in 2015 started off weakly, with a -50% selloff in the
first two weeks of the year. This included a -24% drop in just one day on
the 14th of January. This may have been inspired by the announcement from
prominent European exchange Bitstamp that they had lost 19,000 BTC in a
hack. Coinbase had better news, though, as the exchange raised $75 million
in its Series C funding round.
$150 marked the local bottom for the year, though. In fact, January 2015 was
the last time you could ever buy 1 BTC for $150. The price of Bitcoin topped
$500 for the first time in over a year later in 2015.
In June, the New York State Department of Financial Services began its
investigation into Bitcoin and cryptocurrencies. This investigation would
eventually lead to the creation of the BitLicense.
In November, the Unicode Committee adopted the current Bitcoin currency
symbol (
₿
), giving the internet's first widespread native currency
its own character.
How Much was 1 Bitcoin Worth in 2016?
Bitcoin Price during 2016
2016 saw the Bitcoin network's hash rate top 1 exahash/second. The hash rate
reflects the amount of computing power committed to Bitcoin and is an
important measure of the strength of the network.
The price of Bitcoin continued its slow but steady appreciation over the
course of the year. After a spike to $750 in June, Bitcoin retraced before
closing the year just shy of the all-important $1,000 mark.
How Much was 1 Bitcoin Worth in 2017?
Bitcoin Price during 2017
2017 is a year that lives in crypto history. As you can see in the chart
above, the year saw a steady appreciation in the price of Bitcoin followed
by a huge blow-off top to nearly $20,000.
This 1,300% increase in price wasn't the largest yearly growth – that title
belongs to 2013 with its 6,600% gains – but it was the first time that
Bitcoin truly broke into the mainstream of public opinion.
A $19,000 Bitcoin is impossible to ignore.
Bitcoin once again broke the $1,000 resistance on January 1st for the first
time in three years, and after the 28th of March it never revisited that
level.
The massive appreciation in price over the course of 2017 was driven in part
by strong retail interest in the cryptocurrency. Trading volume on Bitso -
Mexico's leading exchange - grew 1,500% in the six months ending March 2017.
Poloniex experienced 600% growth in the number of active traders on its
platform throughout the year.
Despite the huge increase in price and subsequent attention paid to Bitcoin,
2017 was not without difficulty for the cryptocurrency. This was the year of
one of the most contentious and hotly-debated events in Bitcoin history: the
Bitcoin Cash hard fork.
While many were concerned about the effects of this fork on Bitcoin, with
the benefit of four years' hindsight its safe to say that Bitcoin Cash lost
the war it started. Today, its market capitalization is less than 1% of
Bitcoin's.
On December 11, Bitcoin futures trading opened at the Chicago Board Options
Exchange, the largest U.S. options exchange. Bitcoin rallied 12% that day,
though its stellar run came to an end just five days later. The high of
$19,000 would not be broken for almost three more years.
How Much was 1 Bitcoin Worth in 2018?
Bitcoin Price during 2018
2018 was a tough year for many in Bitcoin, both seasoned investors and those
new to the space who had been attracted by the hype of 2017.
Bitcoin's year-on-year (YoY) return for 2018 was a painful -73%.
Google, Twitter and Facebook all passed bans on Bitcoin and cryptocurrency
advertisements on their platforms, with the latter claiming that they were
"frequently associated with misleading or deceptive promotional practices."
Bitcoin closed 2018 at $3,693 – more than $10,000 down from where it ended
the previous year.
The good news for investors (though they wouldn't know it just yet) was that
the bottom of Bitcoin's bear market had come on December 15, when the price
hit $3,122.
How Much was 1 Bitcoin Worth in 2019?
Bitcoin Price during 2019
2019 was a rollercoaster ride for Bitcoin hodlers. Starting the year under
$4,000, the price of Bitcoin rose nearly $10,000 to hit $13,880 by the
middle of the year.
Yet these gains did not prove to be sustainable. Bitcoin bled out over the
next six months, a handful of pumps notwithstanding, and ended up closing
the year around $7,160.
Still, the bounce from $3,500 to $13,500 proved that Bitcoin was not dead,
despite the naysayers of the 2018 bear market.
2019 set the stage for what would prove to be one of the most extreme years
in Bitcoin's history: 2020.
How Much was 1 Bitcoin Worth in 2020?
Bitcoin Price during 2020
Bitcoin rose strongly from $7,000 at the beginning of the year to more than
$10,000 in mid-February.
$10,000 proved to be a critical level for Bitcoin throughout the year,
though it would take until October for the price to leave the $10,000s once
and for all.
First came the March crash. Triggered by the Covid-19 pandemic, a global
liquidity event, and exchange liquidation engines run amok, Bitcoin sold off
nearly 40% on March 12. It hit a low of $3,850 before doubling in price over
the next six weeks.
Bitcoin then entered a months-long accumulation pattern, before charging
above $10,000 in late July. It hit a high of over $12,000 before dumping
back to below $10,000 in early September.
This proved to be the final fakeout, though. From September to the end of
the year, the price of Bitcoin rallied 185% to close at just under $29,000.
This was more than $10,000 above the previous all time high set in 2017.
From the agonizing March crash to the parabolic move into the end of the
year, 2020 was a year of extreme highs and lows for Bitcoin.
This was driven in part by institutional investment.
MicroStrategy's purchase of more than $1 billion
worth of Bitcoin
at an average price of $15,964 over the course of 2020 made
headlines. So did the Massachusetts Mutual Life Insurance Company, spending
more than $100 million on Bitcoin. This was a watershed moment for the
cryptocurrency, as insurance companies are known to be conservative in their
investments.
2020 proved that Bitcoin can bounce back strongly from major global events.
In fact, it may even be stronger as a result. Many investors are looking to
Bitcoin as a safe store of value in the face of unprecedented money printing
in many countries.
While it's impossible to tell the future, one thing is for sure: 2021 is
shaping up to be just as important a year in the history of Bitcoin.
How Much was 1 Bitcoin Worth in 2021?
Bitcoin Price during 2021
Starting the year just below the $30,000 mark, Bitcoin experienced a significant rally in the first half, reaching its peak close to $60,000 around April.
However, post-April, the cryptocurrency faced a decline, stabilizing around the $40,000 mark by July.
The remainder of the year showcased a consistent upward trajectory, with a few fluctuations but maintaining its value above the $50,000 mark for a significant duration.
The year ended with Bitcoin slightly retracing from its high but still showcasing an overall upward trend from the start of the year.
How Much was 1 Bitcoin Worth in 2022?
Bitcoin Price during 2022
The year 2022 saw a tumultuous start for Bitcoin. Beginning near the $50,000 mark in January, it experienced a steady decline through the initial months, reaching its lowest point around the $30,000 range in May.
After May, the cryptocurrency did not recover significantly past this point. The price stabilized, hovering between $20,000 to $30,000 for the rest of the year.
There were moments of slight upward movements, but they were met with subsequent declines, maintaining Bitcoin's price within this bracket. The year witnessed a notable constriction in its price volatility, especially when contrasted with previous years.
How Much is Bitcoin Worth in Gold
You can check the Bitcoin price in gold, by
clicking here
.
FAQ
How Much Was Bitcoin When it First Came Out?
Bitcoin did not have a price when it first came out.
Bitcoin was much different than the ICOs we've come to know in nowadays.
Bitcoin was just a passion project created by Satoshi Nakamoto and his
online cypherpunk friends.
Everyone back then acquired Bitcoins by mining them on their personal
computer and trading them with each other just to see if they could.
It really wasn't until Laszlo Hanyecz made the first Bitcoin trade for real
goods (two Papa John's pizzas in exchange for 10,000 Bitcoins) that there
was really even a price applied to Bitcoin at all.
What was The Bitcoin Price 10 Years Ago?
Bitcoin hit $1 for the first time ever on February 9th, 2011. On that day,
forums posts began to emerge suggesting Bitcoiners around the world ought to
throw "parity parties" (meaning a party celebrating Bitcoin's parity with
the US Dollar).
What Was Bitcoin's Lowest Price Ever?
Technically, the lowest Bitcoin price ever was $0.00. That's because for
many years, Bitcoins weren't worth anything.
Bitcoins lowest price after its all time high in 2017 was around $3,350.
How Much is a Share of Bitcoin
We don't really call anything in Bitcoin a "share". This is a term we
generally use for stocks issued on a stock exchange. Bitcoin doesn't really
work that way. All there is is the Bitcoin Price.
Currently the price of a Bitcoin (or a "share of Bitcoin", if you'd like) is
displayed at the top of this page and is updated regularly.
Why did Bitcoin Break its All Time High on February 23, 2017?
Before February 23, 2017, Bitcoin had experienced 2 years of downwards price
action followed by about 2 years of upwards movement. Once it got close to
its previous high, it busted through and continued to run up throughout all
of 2017.
Why did Bitcoin Break its All Time High on November 5, 2013?
This was a wave driven by hype and greed. People had heard about Bitcoin
throughout 2013, but never acted. On its second run, many people finally
took the dive and started to get interested.
Why did Bitcoin Break its All Time High on February 20, 2013
Many believe that Cyprus's financial crisis
(4)
helped create new demand for bitcoins.
When Will Bitcoin Hit a New All Time High Again?
Nobody knows for sure! One trend to notice is that
Bitcoin's supply halving
have often preceded
its historic runs.
Will Bitcoin Ever Hit a New High Again?
Again, nobody knows for sure!
Bitcoin's price has always moved in cycles. It's hard to say if that trend
will continue or if the cycles will be different than in years past. |
| Markdown | [Charts](https://charts.bitbo.io/index/) [Private Charts](https://charts.bitbo.io/private/) [Indicators](https://charts.bitbo.io/indicators/) [Reports](https://charts.bitbo.io/reports/) [Alerts](https://charts.bitbo.io/alerts/) [API](https://charts.bitbo.io/btc-api/) [Terminal](https://charts.bitbo.io/terminal/) [Pricing](https://charts.bitbo.io/pricing/)
[Signup](https://charts.bitbo.io/signup/) [Login](https://charts.bitbo.io/login/) [Upgrade](https://charts.bitbo.io/pricing/)
[Login](https://charts.bitbo.io/login/)
- Bitbo Charts
- Stock to Flow
- [Stock to Flow](https://charts.bitbo.io/stock-to-flow/)
- [Stock to Flow Cross Asset](https://charts.bitbo.io/s2fx/)
- [S2F Value](https://charts.bitbo.io/sf-value/)
- [Stock to Flow Ratio](https://charts.bitbo.io/sf-multiple/)
- [BTC Priced in Gold S2F](https://charts.bitbo.io/sf-gold/)
- [Colored Stock to Flow](https://charts.bitbo.io/colored-s2f/)
- [S2F Power Law Average](https://charts.bitbo.io/sf-power-law/)
- [S2F, Realized Price, RSI, 200WK MA](https://charts.bitbo.io/sf-rsi-ma-rp/)
- [Stock to Flow Rainbow](https://charts.bitbo.io/sf-rainbow/)
- [S2F Bands](https://charts.bitbo.io/sf-v1-bands/)
- On-chain
- [SOPR](https://charts.bitbo.io/sopr/)
- [NUPL](https://charts.bitbo.io/net-unrealized-profit-loss/)
- [VDD Multiple](https://charts.bitbo.io/vdd-multiple/)
- [NVT](https://charts.bitbo.io/nvt/)
- [Coin Days Destroyed](https://charts.bitbo.io/cdd/)
- [Blocks Daily](https://charts.bitbo.io/blocks-daily/)
- [CVDD](https://charts.bitbo.io/cvdd/)
- [Market Cycles](https://charts.bitbo.io/market-cycles/)
- [STH SOPR](https://charts.bitbo.io/sth-sopr/)
- [LTH SOPR](https://charts.bitbo.io/lth-sopr/)
- [SOPR Ratio](https://charts.bitbo.io/sopr-ratio/)
- [Dormant Coins](https://charts.bitbo.io/dormant-coins/)
- [SegWit Adoption](https://charts.bitbo.io/segwit-adoption/)
- [Daily Transaction Volume](https://charts.bitbo.io/tx-per-day/)
- [Fees per Block](https://charts.bitbo.io/fees-per-block/)
- [Fees per Day](https://charts.bitbo.io/fees-per-day/)
- Realized Price
- [Realized Price](https://charts.bitbo.io/realized-price/)
- [STH Realized Price](https://charts.bitbo.io/sth-realized-price/)
- [LTH Realized Price](https://charts.bitbo.io/lth-realized-price/)
- [180D Realized Price Change](https://charts.bitbo.io/180-day-rp-change/)
- [Realized Price by Age](https://charts.bitbo.io/realized-price-by-age/)
- [STH, 2-Year, Realized Price](https://charts.bitbo.io/5m-2yr-rp/)
- [Realized Price Momentum](https://charts.bitbo.io/realized-price-momentum/)
- [50 MARP Momentum](https://charts.bitbo.io/50marp-momentum/)
- [Realized Movement Zones](https://charts.bitbo.io/realized-movement-zones/)
- [STH/LTH/Regular Realized Price](https://charts.bitbo.io/rp-lth-sth/)
- [STH SD Deviation Bands](https://charts.bitbo.io/sth-rp-standard-deviation-bands/)
- Price Projection
- [Cycle Repeat](https://charts.bitbo.io/cycle-repeat/)
- [Long Term Power Law](https://charts.bitbo.io/long-term-power-law/)
- [Cycle Low Multiple](https://charts.bitbo.io/cycle-low-multiple/)
- [Price Prediction](https://charts.bitbo.io/price-prediction/)
- [Rainbow (Halving)](https://charts.bitbo.io/rainbow/)
- [Rainbow (Original)](https://charts.bitbo.io/original-rainbow/)
- [Stock to Income](https://charts.bitbo.io/stock-to-income/)
- [Reward Era Compare](https://charts.bitbo.io/reward-era-comparison/)
- [Compare Bull Markets](https://charts.bitbo.io/compare-bull-markets/)
- [Power Law Rainbow](https://charts.bitbo.io/power-law-rainbow/)
- [Colored Power Law](https://charts.bitbo.io/colored-power-law/)
- [Advanced Cycle Repeat](https://charts.bitbo.io/advanced-cycle-repeat/)
- [Realized Price Projection](https://charts.bitbo.io/realized-price-projection/)
- [Pi-Cycle Top Estimate Plus Price Models](https://charts.bitbo.io/pi-cycle-estimate-price-models/)
- Moving Averages
- [Pi Cycle Top](https://charts.bitbo.io/pi-cycle-top/)
- [Pi Cycle Top Estimate](https://charts.bitbo.io/pi-cycle-top-estimate/)
- [Mayer Multiple](https://charts.bitbo.io/mayermultiple/)
- [1458 Day MA Heatmap](https://charts.bitbo.io/sma1458/)
- [Golden Ratio Multiplier](https://charts.bitbo.io/golden-ratio/)
- [Mayer Bands](https://charts.bitbo.io/mayer-bands/)
- [90-Day Multiple](https://charts.bitbo.io/90-days-multiple/)
- [50/200 Day MA](https://charts.bitbo.io/50-200-day-ma/)
- [Mayer Multiple Bars](https://charts.bitbo.io/mayer-multiple-bars/)
- [Bollinger Bands](https://charts.bitbo.io/bollinger-bands/)
- [Power Law & 4Y MA](https://charts.bitbo.io/4y-ma-power-law/)
- [50 Week MA](https://charts.bitbo.io/50w-ma/)
- [200 Week MA](https://charts.bitbo.io/ma-200w/)
- [300 Week MA](https://charts.bitbo.io/300w-ma/)
- [50 MARP](https://charts.bitbo.io/50marp/)
- [Realized Mayer Multiple](https://charts.bitbo.io/realized-mayer-multiple/)
- [Colored Mayer Multiple](https://charts.bitbo.io/colored-mayer-multiple/)
- [MA 200W vs Cycles](https://charts.bitbo.io/ma-200w-cycles/)
- Indicators
- [Bitcoin Indicator Dashboard](https://charts.bitbo.io/panels/)
- [Fear and Greed Index](https://charts.bitbo.io/fear-greed/)
- [RSI](https://charts.bitbo.io/monthly-rsi/)
- [Daily RSI](https://charts.bitbo.io/daily-rsi/)
- [Power Law Oscillator](https://charts.bitbo.io/power-law-oscillator/)
- [BEAM](https://charts.bitbo.io/beam/)
- [Thermocap](https://charts.bitbo.io/thermocap-multiple/)
- [MACD](https://charts.bitbo.io/macd/)
- [Cycle Extreme Indicators](https://charts.bitbo.io/cycle-extremes/)
- [Fear/Greed 100-Day MA](https://charts.bitbo.io/fear-greed-100-day-ma/)
- Mining
- [Difficulty](https://charts.bitbo.io/mining-difficulty/)
- [Hashrate](https://charts.bitbo.io/hashrate/)
- [Miner Capitulation](https://charts.bitbo.io/miner-capitulation/)
- [Puell Multiple](https://charts.bitbo.io/puell-multiple/)
- [Fee % of Reward](https://charts.bitbo.io/fees-percent-of-reward/)
- [Hash Ribbons](https://charts.bitbo.io/hash-ribbons/)
- [Future Supply](https://charts.bitbo.io/future-supply/)
- [Miner Revenue](https://charts.bitbo.io/miner-monthly-revenue/)
- [Hash Price](https://charts.bitbo.io/hash-price/)
- [Block Subsidy](https://charts.bitbo.io/block-subsidy/)
- [Difficulty Estimate](https://charts.bitbo.io/difficulty-estimate/)
- [Network Energy Usage](https://charts.bitbo.io/energy-consumption/)
- [Energy per TX](https://charts.bitbo.io/energy-per-tx/)
- [Difficulty Retarget Estimate](https://charts.bitbo.io/difficulty-retarget/)
- Price
- [Mayer+S2F](https://charts.bitbo.io/mayer-multiple/)
- [Satoshi Per Dollar](https://charts.bitbo.io/satoshi-per-dollar/)
- [Days Since High](https://charts.bitbo.io/days-since-high/)
- [4 Year Multiple](https://charts.bitbo.io/4y-multiple/)
- [Days Higher Than Current](https://charts.bitbo.io/days-higher-than-current/)
- [Never Look Back](https://charts.bitbo.io/never-look-back-price/)
- [Yearly Candles](https://charts.bitbo.io/yearly-candles/)
- [Sharpe Ratio](https://charts.bitbo.io/sharpe-ratio/)
- [Monthly Price & Returns](https://charts.bitbo.io/monthly-performance/)
- [YoY Price Change](https://charts.bitbo.io/price-year-over-year/)
- [Drawdown From High](https://charts.bitbo.io/price-drawdown-from-all-time-high/)
- [Quarterly Returns](https://charts.bitbo.io/bitcoin-quarterly-price-performance/)
- [Daily Price Performance](https://charts.bitbo.io/bitcoin-daily-price-performance/)
- [Profitable Days](https://charts.bitbo.io/profitable-days/)
- [Price On Current Date](https://charts.bitbo.io/price-current-date/)
- [All-Time High](https://charts.bitbo.io/ath/)
- [Avg Daily Returns](https://charts.bitbo.io/avg-daily-returns/)
- [Bear Markets](https://charts.bitbo.io/bear-markets/)
- [ROI From Peaks](https://charts.bitbo.io/roi-from-peaks/)
- [Yearly ROI](https://charts.bitbo.io/yearly-roi/)
- Halving
- [Halving Spiral](https://charts.bitbo.io/halving-spiral/)
- [Halving progress](https://charts.bitbo.io/halving-progress/)
- [With/Without Halving](https://charts.bitbo.io/with-without-halving/)
- [Price After Halving](https://charts.bitbo.io/price-after-halving/)
- Priced in BTC
- [S\&P500 Priced In Bitcoin](https://charts.bitbo.io/sp500-btc/)
- [NASDAQ Priced In Bitcoin](https://charts.bitbo.io/nasdaq-btc/)
- [Eggs Priced in Bitcoin](https://charts.bitbo.io/eggs/)
- [Stocks vs BTC](https://charts.bitbo.io/stocks-vs-btc/)
- [MSTR-BTC Ratio](https://charts.bitbo.io/mstr-btc/)
- [US Median House Price in BTC](https://charts.bitbo.io/housing-btc/)
- [US Gas Priced in BTC](https://charts.bitbo.io/gas-btc/)
- [U.S. Beef Priced in Bitcoin](https://charts.bitbo.io/beef-btc/)
- Macro
- [CPI](https://charts.bitbo.io/cpi/)
- [US M2 Money Supply](https://charts.bitbo.io/us-m2/)
- [US M1 Money Supply](https://charts.bitbo.io/us-m1/)
- [US Dollar Devaluation](https://charts.bitbo.io/dollar-devaluation/)
- [US Treasury Yield](https://charts.bitbo.io/10yr-treasury/)
- [US Mortgage Rate](https://charts.bitbo.io/us-mortgage-rate/)
- [Fed Funds Rate](https://charts.bitbo.io/fed-funds/)
- [Volatility Index (VIX)](https://charts.bitbo.io/vix/)
- [Fed Balance Sheet](https://charts.bitbo.io/fed-balance-sheet/)
- [S\&P 500 (BTC/USD/XAU)](https://charts.bitbo.io/sp500-usd-gold-btc/)
- [BTC vs Gold Z-Score](https://charts.bitbo.io/btc-gold-z-score/)
- ETFs
- [ETF Holdings vs New Supply](https://charts.bitbo.io/etf-holdings-vs-new-supply/)
- [ETFs Percent of Market Cap](https://charts.bitbo.io/etf-percent-market-cap/)
- [ETF Flows vs New BTC (Net)](https://charts.bitbo.io/etf-flows-vs-new-btc/)
- [ETF Flows vs New BTC (Raw)](https://charts.bitbo.io/etf-flows-vs-new-btc-raw/)
- HODL Waves
- [1Y+ HODL Wave](https://charts.bitbo.io/1y-hodl-wave/)
- [HODL Waves](https://charts.bitbo.io/hodl-waves/)
- [2Y+ HODL Wave](https://charts.bitbo.io/2y-hodl-wave/)
- [3y+ HODL Wave](https://charts.bitbo.io/3y-hodl-wave/)
- [5y+ HODL Wave](https://charts.bitbo.io/5y-hodl-wave/)
- [7y+ HODL Wave](https://charts.bitbo.io/7y-hodl-wave/)
- [10y+ HODL Wave](https://charts.bitbo.io/10y-hodl-wave/)
- [Realized HODL Waves](https://charts.bitbo.io/realized-hodl-waves/)
- MVRV
- [MVRV](https://charts.bitbo.io/mvrv/)
- [MVRV Z Score](https://charts.bitbo.io/mvrv-z-score/)
- [Long Term Holder MVRV](https://charts.bitbo.io/lth-mvrv/)
- [Short Term Holder MVRV](https://charts.bitbo.io/sth-mvrv/)
- [LTH-STH MVRV Difference](https://charts.bitbo.io/lth-sth-mvrv-diff/)
- [MVRV Crosses](https://charts.bitbo.io/mvrv-crosses/)
- Calculators
- [Retirement Calculator](https://charts.bitbo.io/retirement-calculator/)
- [DCA Calculator](https://charts.bitbo.io/dca/)
- [Backtest Calculator](https://charts.bitbo.io/backtest/)
- [BTC Loan Calculator](https://charts.bitbo.io/loan-calculator/)
- [CAGR Calculator](https://charts.bitbo.io/cagr-calculator/)
- [Returns Comparison](https://charts.bitbo.io/returns-compare/)
- [BTC vs Gold Returns](https://charts.bitbo.io/btc-vs-gold-returns/)
- Supply & Holders
- [Long Term Holder Supply](https://charts.bitbo.io/long-term-holder-supply/)
- [Circulating Supply](https://charts.bitbo.io/circulating-supply/)
- [Unspent Outputs](https://charts.bitbo.io/unspent-outputs/)
- [Circulation](https://charts.bitbo.io/circulating-coins/)
- [Short Term Holder Supply](https://charts.bitbo.io/short-term-holder-supply/)
- [STH Supply Change](https://charts.bitbo.io/sth-supply-change/)
- [LTH Supply Change](https://charts.bitbo.io/lth-supply-change/)
- [Supply In Profit](https://charts.bitbo.io/supply-in-profit/)
- [Ancient Supply](https://charts.bitbo.io/ancient-supply/)
- [Ancient Supply Growth](https://charts.bitbo.io/ancient-supply-growth/)
- [Ancient Supply Daily Issuance](https://charts.bitbo.io/ancient-supply-daily-issuance/)
- [Ancient Supply Decreases](https://charts.bitbo.io/ancient-supply-decrease/)
- [STH Profit Ratio](https://charts.bitbo.io/sth-profit-ratio/)
- Other
- [Bitcoin Priced in Gold](https://charts.bitbo.io/btc-gold/)
- [Fee Ratio Multiple](https://charts.bitbo.io/fee-ratio-multiple/)
- [Price Temperature](https://charts.bitbo.io/bitcoin-price-temperature/)
- [Inflation](https://charts.bitbo.io/inflation/)
- [Days Since All Time High](https://charts.bitbo.io/days-since-all-time-high/)
- [Satoshi Net Worth](https://charts.bitbo.io/satoshi-net-worth/)
- [US GDP](https://charts.bitbo.io/us-gdp/)
- [Realized Price (10yr)](https://charts.bitbo.io/10yr-realized-price/)
- [Flippening](https://charts.bitbo.io/flippening/)
- [Real Bitcoin Dominance](https://charts.bitbo.io/bitcoin-dominance/)
- [Bitcoin Market Cap](https://charts.bitbo.io/market-cap/)
- [US Bitcoin Reserve](https://charts.bitbo.io/us-bitcoin-reserve/)
- [CAGR](https://charts.bitbo.io/cagr/)
- [Avg Block Time](https://charts.bitbo.io/avg-block-time/)
- [BTC Priced in Silver](https://charts.bitbo.io/price-silver/)
- [BTC vs Silver Returns](https://charts.bitbo.io/btc-vs-silver-returns/)
- [Tether Market Cap (YoY)](https://charts.bitbo.io/tether-mkt-cap-yoy/)
- [Tether Market Cap (MoM)](https://charts.bitbo.io/tether-mkt-cap-mom/)
- [4y Comparison](https://charts.bitbo.io/4y-comparison/)
- [DXY vs BTC](https://charts.bitbo.io/dxy/)
- [SP500-Gold Ratio](https://charts.bitbo.io/sp-gold-ratio/)
- [Home](https://charts.bitbo.io/panels/)
- Stock to Flow
- On-chain
- Realized Price
- Price Projection
- Moving Averages
- Indicators
- Mining
- Price
- Halving
- Priced in BTC
- Macro
- ETFs
- HODL Waves
- MVRV
- Calculators
- Supply & Holders
- Other
## Close sidebar
- [Stock to Flow](https://charts.bitbo.io/stock-to-flow/)
- [Stock to Flow Cross Asset](https://charts.bitbo.io/s2fx/)
- [S2F Value](https://charts.bitbo.io/sf-value/)
- [Stock to Flow Ratio](https://charts.bitbo.io/sf-multiple/)
- [BTC Priced in Gold S2F](https://charts.bitbo.io/sf-gold/)
- [Colored Stock to Flow](https://charts.bitbo.io/colored-s2f/) Pro
- [S2F Power Law Average](https://charts.bitbo.io/sf-power-law/) Pro
- [S2F, Realized Price, RSI, 200WK MA](https://charts.bitbo.io/sf-rsi-ma-rp/) Pro
- [Stock to Flow Rainbow](https://charts.bitbo.io/sf-rainbow/) Pro
- [S2F Bands](https://charts.bitbo.io/sf-v1-bands/) Pro
## Close sidebar
- [SOPR](https://charts.bitbo.io/sopr/)
- [NUPL](https://charts.bitbo.io/net-unrealized-profit-loss/)
- [VDD Multiple](https://charts.bitbo.io/vdd-multiple/)
- [NVT](https://charts.bitbo.io/nvt/)
- [Coin Days Destroyed](https://charts.bitbo.io/cdd/)
- [Blocks Daily](https://charts.bitbo.io/blocks-daily/)
- [CVDD](https://charts.bitbo.io/cvdd/)
- [Market Cycles](https://charts.bitbo.io/market-cycles/) Pro
- [STH SOPR](https://charts.bitbo.io/sth-sopr/) Pro
- [LTH SOPR](https://charts.bitbo.io/lth-sopr/) Pro
- [SOPR Ratio](https://charts.bitbo.io/sopr-ratio/) Pro
- [Dormant Coins](https://charts.bitbo.io/dormant-coins/)
- [SegWit Adoption](https://charts.bitbo.io/segwit-adoption/)
- [Daily Transaction Volume](https://charts.bitbo.io/tx-per-day/)
- [Fees per Block](https://charts.bitbo.io/fees-per-block/)
- [Fees per Day](https://charts.bitbo.io/fees-per-day/)
## Close sidebar
- [Realized Price](https://charts.bitbo.io/realized-price/)
- [STH Realized Price](https://charts.bitbo.io/sth-realized-price/)
- [LTH Realized Price](https://charts.bitbo.io/lth-realized-price/)
- [180D Realized Price Change](https://charts.bitbo.io/180-day-rp-change/)
- [Realized Price by Age](https://charts.bitbo.io/realized-price-by-age/) Pro
- [STH, 2-Year, Realized Price](https://charts.bitbo.io/5m-2yr-rp/) Pro
- [Realized Price Momentum](https://charts.bitbo.io/realized-price-momentum/) Pro
- [50 MARP Momentum](https://charts.bitbo.io/50marp-momentum/) Pro
- [Realized Movement Zones](https://charts.bitbo.io/realized-movement-zones/) Pro
- [STH/LTH/Regular Realized Price](https://charts.bitbo.io/rp-lth-sth/) Pro
- [STH SD Deviation Bands](https://charts.bitbo.io/sth-rp-standard-deviation-bands/) Pro
## Close sidebar
- [Cycle Repeat](https://charts.bitbo.io/cycle-repeat/)
- [Long Term Power Law](https://charts.bitbo.io/long-term-power-law/)
- [Cycle Low Multiple](https://charts.bitbo.io/cycle-low-multiple/)
- [Price Prediction](https://charts.bitbo.io/price-prediction/)
- [Rainbow (Halving)](https://charts.bitbo.io/rainbow/)
- [Rainbow (Original)](https://charts.bitbo.io/original-rainbow/)
- [Stock to Income](https://charts.bitbo.io/stock-to-income/)
- [Reward Era Compare](https://charts.bitbo.io/reward-era-comparison/)
- [Compare Bull Markets](https://charts.bitbo.io/compare-bull-markets/)
- [Power Law Rainbow](https://charts.bitbo.io/power-law-rainbow/) Pro
- [Colored Power Law](https://charts.bitbo.io/colored-power-law/) Pro
- [Advanced Cycle Repeat](https://charts.bitbo.io/advanced-cycle-repeat/) Pro
- [Realized Price Projection](https://charts.bitbo.io/realized-price-projection/) Pro
- [Pi-Cycle Top Estimate Plus Price Models](https://charts.bitbo.io/pi-cycle-estimate-price-models/) Pro
## Close sidebar
- [Pi Cycle Top](https://charts.bitbo.io/pi-cycle-top/)
- [Pi Cycle Top Estimate](https://charts.bitbo.io/pi-cycle-top-estimate/)
- [Mayer Multiple](https://charts.bitbo.io/mayermultiple/)
- [1458 Day MA Heatmap](https://charts.bitbo.io/sma1458/)
- [Golden Ratio Multiplier](https://charts.bitbo.io/golden-ratio/)
- [Mayer Bands](https://charts.bitbo.io/mayer-bands/)
- [90-Day Multiple](https://charts.bitbo.io/90-days-multiple/)
- [50/200 Day MA](https://charts.bitbo.io/50-200-day-ma/)
- [Mayer Multiple Bars](https://charts.bitbo.io/mayer-multiple-bars/)
- [Bollinger Bands](https://charts.bitbo.io/bollinger-bands/)
- [Power Law & 4Y MA](https://charts.bitbo.io/4y-ma-power-law/)
- [50 Week MA](https://charts.bitbo.io/50w-ma/)
- [200 Week MA](https://charts.bitbo.io/ma-200w/)
- [300 Week MA](https://charts.bitbo.io/300w-ma/)
- [50 MARP](https://charts.bitbo.io/50marp/) Pro
- [Realized Mayer Multiple](https://charts.bitbo.io/realized-mayer-multiple/) Pro
- [Colored Mayer Multiple](https://charts.bitbo.io/colored-mayer-multiple/) Pro
- [MA 200W vs Cycles](https://charts.bitbo.io/ma-200w-cycles/) Pro
## Close sidebar
- [Bitcoin Indicator Dashboard](https://charts.bitbo.io/panels/)
- [Fear and Greed Index](https://charts.bitbo.io/fear-greed/)
- [RSI](https://charts.bitbo.io/monthly-rsi/)
- [Daily RSI](https://charts.bitbo.io/daily-rsi/)
- [Power Law Oscillator](https://charts.bitbo.io/power-law-oscillator/)
- [BEAM](https://charts.bitbo.io/beam/)
- [Thermocap](https://charts.bitbo.io/thermocap-multiple/)
- [MACD](https://charts.bitbo.io/macd/)
- [Cycle Extreme Indicators](https://charts.bitbo.io/cycle-extremes/) Pro
- [Fear/Greed 100-Day MA](https://charts.bitbo.io/fear-greed-100-day-ma/) Pro
## Close sidebar
- [Difficulty](https://charts.bitbo.io/mining-difficulty/)
- [Hashrate](https://charts.bitbo.io/hashrate/)
- [Miner Capitulation](https://charts.bitbo.io/miner-capitulation/)
- [Puell Multiple](https://charts.bitbo.io/puell-multiple/)
- [Fee % of Reward](https://charts.bitbo.io/fees-percent-of-reward/)
- [Hash Ribbons](https://charts.bitbo.io/hash-ribbons/)
- [Future Supply](https://charts.bitbo.io/future-supply/)
- [Miner Revenue](https://charts.bitbo.io/miner-monthly-revenue/)
- [Hash Price](https://charts.bitbo.io/hash-price/)
- [Block Subsidy](https://charts.bitbo.io/block-subsidy/)
- [Difficulty Estimate](https://charts.bitbo.io/difficulty-estimate/)
- [Network Energy Usage](https://charts.bitbo.io/energy-consumption/)
- [Energy per TX](https://charts.bitbo.io/energy-per-tx/)
- [Difficulty Retarget Estimate](https://charts.bitbo.io/difficulty-retarget/)
## Close sidebar
- [Mayer+S2F](https://charts.bitbo.io/mayer-multiple/)
- [Satoshi Per Dollar](https://charts.bitbo.io/satoshi-per-dollar/)
- [Days Since High](https://charts.bitbo.io/days-since-high/)
- [4 Year Multiple](https://charts.bitbo.io/4y-multiple/)
- [Days Higher Than Current](https://charts.bitbo.io/days-higher-than-current/)
- [Never Look Back](https://charts.bitbo.io/never-look-back-price/)
- [Yearly Candles](https://charts.bitbo.io/yearly-candles/)
- [Sharpe Ratio](https://charts.bitbo.io/sharpe-ratio/)
- [Monthly Price & Returns](https://charts.bitbo.io/monthly-performance/)
- [YoY Price Change](https://charts.bitbo.io/price-year-over-year/)
- [Drawdown From High](https://charts.bitbo.io/price-drawdown-from-all-time-high/)
- [Quarterly Returns](https://charts.bitbo.io/bitcoin-quarterly-price-performance/)
- [Daily Price Performance](https://charts.bitbo.io/bitcoin-daily-price-performance/)
- [Profitable Days](https://charts.bitbo.io/profitable-days/)
- [Price On Current Date](https://charts.bitbo.io/price-current-date/)
- [All-Time High](https://charts.bitbo.io/ath/)
- [Avg Daily Returns](https://charts.bitbo.io/avg-daily-returns/)
- [Bear Markets](https://charts.bitbo.io/bear-markets/)
- [ROI From Peaks](https://charts.bitbo.io/roi-from-peaks/) Pro
- [Yearly ROI](https://charts.bitbo.io/yearly-roi/) Pro
## Close sidebar
- [Halving Spiral](https://charts.bitbo.io/halving-spiral/)
- [Halving progress](https://charts.bitbo.io/halving-progress/)
- [With/Without Halving](https://charts.bitbo.io/with-without-halving/) Pro
- [Price After Halving](https://charts.bitbo.io/price-after-halving/) Pro
## Close sidebar
- [S\&P500 Priced In Bitcoin](https://charts.bitbo.io/sp500-btc/)
- [NASDAQ Priced In Bitcoin](https://charts.bitbo.io/nasdaq-btc/)
- [Eggs Priced in Bitcoin](https://charts.bitbo.io/eggs/)
- [Stocks vs BTC](https://charts.bitbo.io/stocks-vs-btc/) Pro
- [MSTR-BTC Ratio](https://charts.bitbo.io/mstr-btc/) Pro
- [US Median House Price in BTC](https://charts.bitbo.io/housing-btc/)
- [US Gas Priced in BTC](https://charts.bitbo.io/gas-btc/)
- [U.S. Beef Priced in Bitcoin](https://charts.bitbo.io/beef-btc/)
## Close sidebar
- [CPI](https://charts.bitbo.io/cpi/)
- [US M2 Money Supply](https://charts.bitbo.io/us-m2/)
- [US M1 Money Supply](https://charts.bitbo.io/us-m1/)
- [US Dollar Devaluation](https://charts.bitbo.io/dollar-devaluation/)
- [US Treasury Yield](https://charts.bitbo.io/10yr-treasury/)
- [US Mortgage Rate](https://charts.bitbo.io/us-mortgage-rate/)
- [Fed Funds Rate](https://charts.bitbo.io/fed-funds/)
- [Volatility Index (VIX)](https://charts.bitbo.io/vix/)
- [Fed Balance Sheet](https://charts.bitbo.io/fed-balance-sheet/)
- [S\&P 500 (BTC/USD/XAU)](https://charts.bitbo.io/sp500-usd-gold-btc/)
- [BTC vs Gold Z-Score](https://charts.bitbo.io/btc-gold-z-score/) Pro
## Close sidebar
- [ETF Holdings vs New Supply](https://charts.bitbo.io/etf-holdings-vs-new-supply/) Pro
- [ETFs Percent of Market Cap](https://charts.bitbo.io/etf-percent-market-cap/) Pro
- [ETF Flows vs New BTC (Net)](https://charts.bitbo.io/etf-flows-vs-new-btc/) Pro
- [ETF Flows vs New BTC (Raw)](https://charts.bitbo.io/etf-flows-vs-new-btc-raw/) Pro
## Close sidebar
- [1Y+ HODL Wave](https://charts.bitbo.io/1y-hodl-wave/)
- [HODL Waves](https://charts.bitbo.io/hodl-waves/)
- [2Y+ HODL Wave](https://charts.bitbo.io/2y-hodl-wave/)
- [3y+ HODL Wave](https://charts.bitbo.io/3y-hodl-wave/)
- [5y+ HODL Wave](https://charts.bitbo.io/5y-hodl-wave/)
- [7y+ HODL Wave](https://charts.bitbo.io/7y-hodl-wave/)
- [10y+ HODL Wave](https://charts.bitbo.io/10y-hodl-wave/)
- [Realized HODL Waves](https://charts.bitbo.io/realized-hodl-waves/) Pro
## Close sidebar
- [MVRV](https://charts.bitbo.io/mvrv/)
- [MVRV Z Score](https://charts.bitbo.io/mvrv-z-score/)
- [Long Term Holder MVRV](https://charts.bitbo.io/lth-mvrv/) Pro
- [Short Term Holder MVRV](https://charts.bitbo.io/sth-mvrv/) Pro
- [LTH-STH MVRV Difference](https://charts.bitbo.io/lth-sth-mvrv-diff/) Pro
- [MVRV Crosses](https://charts.bitbo.io/mvrv-crosses/) Pro
## Close sidebar
- [Retirement Calculator](https://charts.bitbo.io/retirement-calculator/)
- [DCA Calculator](https://charts.bitbo.io/dca/)
- [Backtest Calculator](https://charts.bitbo.io/backtest/)
- [BTC Loan Calculator](https://charts.bitbo.io/loan-calculator/)
- [CAGR Calculator](https://charts.bitbo.io/cagr-calculator/)
- [Returns Comparison](https://charts.bitbo.io/returns-compare/)
- [BTC vs Gold Returns](https://charts.bitbo.io/btc-vs-gold-returns/)
## Close sidebar
- [Long Term Holder Supply](https://charts.bitbo.io/long-term-holder-supply/)
- [Circulating Supply](https://charts.bitbo.io/circulating-supply/)
- [Unspent Outputs](https://charts.bitbo.io/unspent-outputs/)
- [Circulation](https://charts.bitbo.io/circulating-coins/)
- [Short Term Holder Supply](https://charts.bitbo.io/short-term-holder-supply/) Pro
- [STH Supply Change](https://charts.bitbo.io/sth-supply-change/) Pro
- [LTH Supply Change](https://charts.bitbo.io/lth-supply-change/) Pro
- [Supply In Profit](https://charts.bitbo.io/supply-in-profit/) Pro
- [Ancient Supply](https://charts.bitbo.io/ancient-supply/) Pro
- [Ancient Supply Growth](https://charts.bitbo.io/ancient-supply-growth/) Pro
- [Ancient Supply Daily Issuance](https://charts.bitbo.io/ancient-supply-daily-issuance/) Pro
- [Ancient Supply Decreases](https://charts.bitbo.io/ancient-supply-decrease/) Pro
- [STH Profit Ratio](https://charts.bitbo.io/sth-profit-ratio/) Pro
## Close sidebar
- [Bitcoin Priced in Gold](https://charts.bitbo.io/btc-gold/)
- [Fee Ratio Multiple](https://charts.bitbo.io/fee-ratio-multiple/)
- [Price Temperature](https://charts.bitbo.io/bitcoin-price-temperature/)
- [Inflation](https://charts.bitbo.io/inflation/)
- [Days Since All Time High](https://charts.bitbo.io/days-since-all-time-high/)
- [Satoshi Net Worth](https://charts.bitbo.io/satoshi-net-worth/)
- [US GDP](https://charts.bitbo.io/us-gdp/)
- [Realized Price (10yr)](https://charts.bitbo.io/10yr-realized-price/)
- [Flippening](https://charts.bitbo.io/flippening/)
- [Real Bitcoin Dominance](https://charts.bitbo.io/bitcoin-dominance/)
- [Bitcoin Market Cap](https://charts.bitbo.io/market-cap/)
- [US Bitcoin Reserve](https://charts.bitbo.io/us-bitcoin-reserve/)
- [CAGR](https://charts.bitbo.io/cagr/)
- [Avg Block Time](https://charts.bitbo.io/avg-block-time/)
- [BTC Priced in Silver](https://charts.bitbo.io/price-silver/)
- [BTC vs Silver Returns](https://charts.bitbo.io/btc-vs-silver-returns/)
- [Tether Market Cap (YoY)](https://charts.bitbo.io/tether-mkt-cap-yoy/) Pro
- [Tether Market Cap (MoM)](https://charts.bitbo.io/tether-mkt-cap-mom/) Pro
- [4y Comparison](https://charts.bitbo.io/4y-comparison/) Pro
- [DXY vs BTC](https://charts.bitbo.io/dxy/) Pro
- [SP500-Gold Ratio](https://charts.bitbo.io/sp-gold-ratio/) Pro
# Bitcoin Price History Chart (Since 2009)
[ 100+ free Bitcoin charts and indicators. charts.bitbo.io/index](https://charts.bitbo.io/index/)
[ View the Bitcoin Fear & Greed Index live. charts.bitbo.io/fear-greed](https://charts.bitbo.io/fear-greed/)
**Current Price:** \$71,585.94 **Today:** 0\.27% -\$194.07
| Period | Dollar Change | Percent Change | |
|---|---|---|---|
| Today | \-\$194.07 | \-0.27% | ↓ |
| Last 7 days | \+\$4,638.98 | \+6.93% | ↑ |
| Last 30 days | \+\$1,393.95 | \+1.99% | ↑ |
| Last 6 months | \-\$41,340.17 | \-36.61% | ↓ |
| Last 1 year | \-\$8,024.09 | \-10.08% | ↓ |
| Last 2 years | \+\$1,014.65 | \+1.44% | ↑ |
| Last 3 years | \+\$41,931.13 | \+141.40% | ↑ |
| Last 5 years | \+\$11,801.14 | \+19.74% | ↑ |
| Last 7 years | \+\$66,267.34 | \+1,245.95% | ↑ |
## Table of Contents
| | |
|---|---|
| [Price in 2009](https://charts.bitbo.io/price/#2009) | [Price in 2017](https://charts.bitbo.io/price/2017) |
| [Price in 2010](https://charts.bitbo.io/price/2010) | [Price in 2018](https://charts.bitbo.io/price/2018) |
| [Price in 2011](https://charts.bitbo.io/price/2011) | [Price in 2019](https://charts.bitbo.io/price/2019) |
| [Price in 2012](https://charts.bitbo.io/price/2012) | [Price in 2020](https://charts.bitbo.io/price/2020) |
| [Price in 2013](https://charts.bitbo.io/price/2013) | [Price in 2021](https://charts.bitbo.io/price/2021) |
| [Price in 2014](https://charts.bitbo.io/price/2014) | [Price in 2022](https://charts.bitbo.io/price/2022) |
| [Price in 2015](https://charts.bitbo.io/price/2015) | [Price in 2023](https://charts.bitbo.io/price/2023) |
| [Price in 2016](https://charts.bitbo.io/price/2016) | [Price in 2024](https://charts.bitbo.io/price/2024) |
[ 100+ free Bitcoin charts and indicators. charts.bitbo.io/index](https://charts.bitbo.io/index/)
[ View the Bitcoin Fear & Greed Index live. charts.bitbo.io/fear-greed](https://charts.bitbo.io/fear-greed/)
## How Much is Bitcoin Worth Today?
Bitcoin is currently worth \$71,585.94 as of the time you loaded this page.
Check [what would have happened if you would have bought Bitcoin.](https://charts.bitbo.io/if-i-bought/)
## How Much was 1 Bitcoin Worth in 2009?
In the very early days of Bitcoin, there were no exchanges that look anything like the offerings today. But there was at least one exchange established in the first year since Bitcoin's inception.
The BitcoinTalk forum went online in late 2009 and soon enough one regular proposed the idea of an exchange where people could buy and sell Bitcoins for fiat currency. Keep in mind that this was when the block reward was 50 BTC and there were very few people mining.
The BitcoinTalk forum member *NewLibertyStandard* set up New Liberty Standard Exchange, and another forum user - *Sirius* - sent him 5050 BTC in exchange for \$5.02 through PayPal. This puts the first recorded price at which Bitcoin exchanged hands at \$0.00099/BTC.
## How Much was 1 Bitcoin Worth in 2010?
Bitcoin's price never topped \$1 in 2010! Its highest price for the year was just \$0.39\!
2010 is the year in which the famous purchase of two Dominos pizzas for 10,000 BTC took place.
BitcoinTalk forum member *laszlo* offered the following trade:
I'll pay 10,000 bitcoins for a couple of pizzas.. like maybe 2 large ones so I have some left over for the next day. I like having left over pizza to nibble on later. You can make the pizza yourself and bring it to my house or order it for me from a delivery place, but what I'm aiming for is getting food delivered in exchange for bitcoins where I don't have to order or prepare it myself, kind of like ordering a 'breakfast platter' at a hotel or something, they just bring you something to eat and you're happy\!
I like things like onions, peppers, sausage, mushrooms, tomatoes, pepperoni, etc.. just standard stuff no weird fish topping or anything like that. I also like regular cheese pizzas which may be cheaper to prepare or otherwise acquire.
If you're interested please let me know and we can work out a deal.
Thanks,
Laszlo
BitcoinTalk Forum[(1)](https://charts.bitbo.io/price/#article-sources)
2010 also saw the opening of the infamous Bitcoin exchange Mt. Gox in July.
## How Much was 1 Bitcoin Worth in 2011?
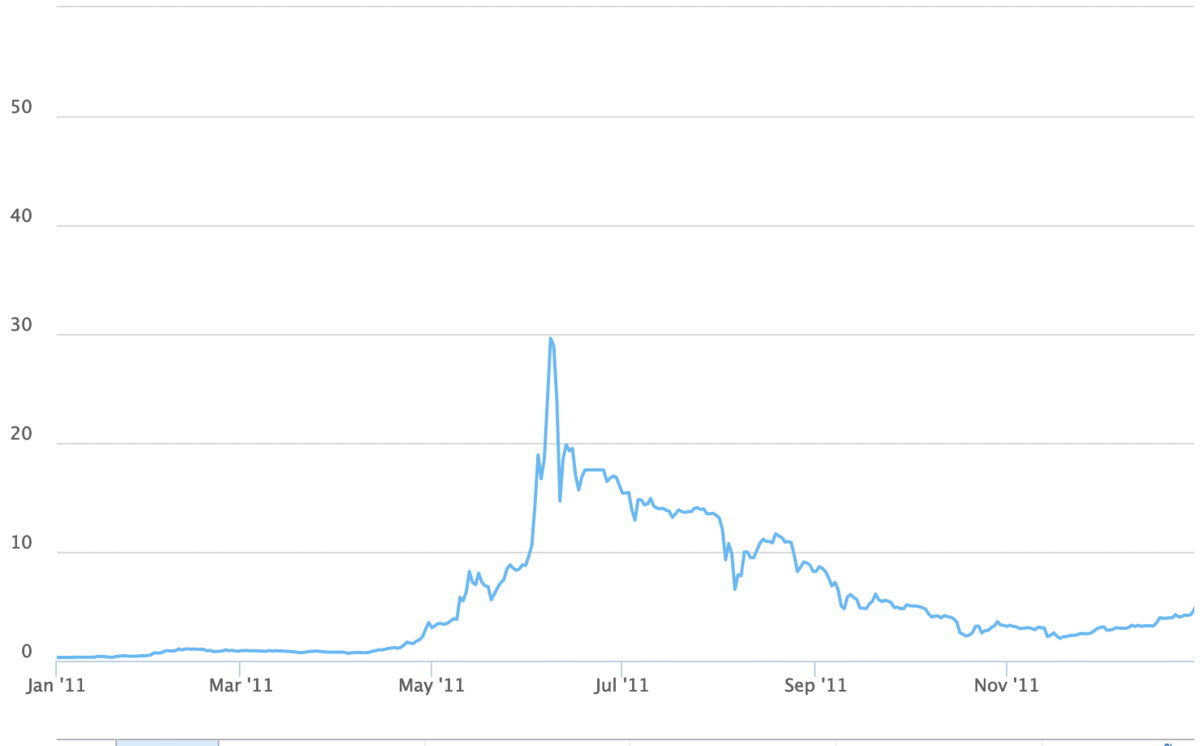
Bitcoin Price during 2011
Bitcoin's adoption started to pick up steam in 2011. The Electronic Frontier Foundation (EFF) accepted Bitcoins as donations for a couple of months in 2011. Due to lack of legal precedent surrounding virtual currencies this arrangement was quickly rescinded, though this was later reversed in 2013 when the EFF began accepting Bitcoin again.
On February 9th, 2011, BTC reached a value of USD\$1.00 for the first time ever. A few months later, in June, the price of one Bitcoin hit \$10, then \$30 on Mt. Gox. This represented a 100x appreciation since the beginning of the year, when the price of Bitcoin hovered around \$0.30.
By the end of the year Bitcoin was trading just under \$5, but at least two important psychological barriers had been broken.
## How Much was 1 Bitcoin Worth in 2012?
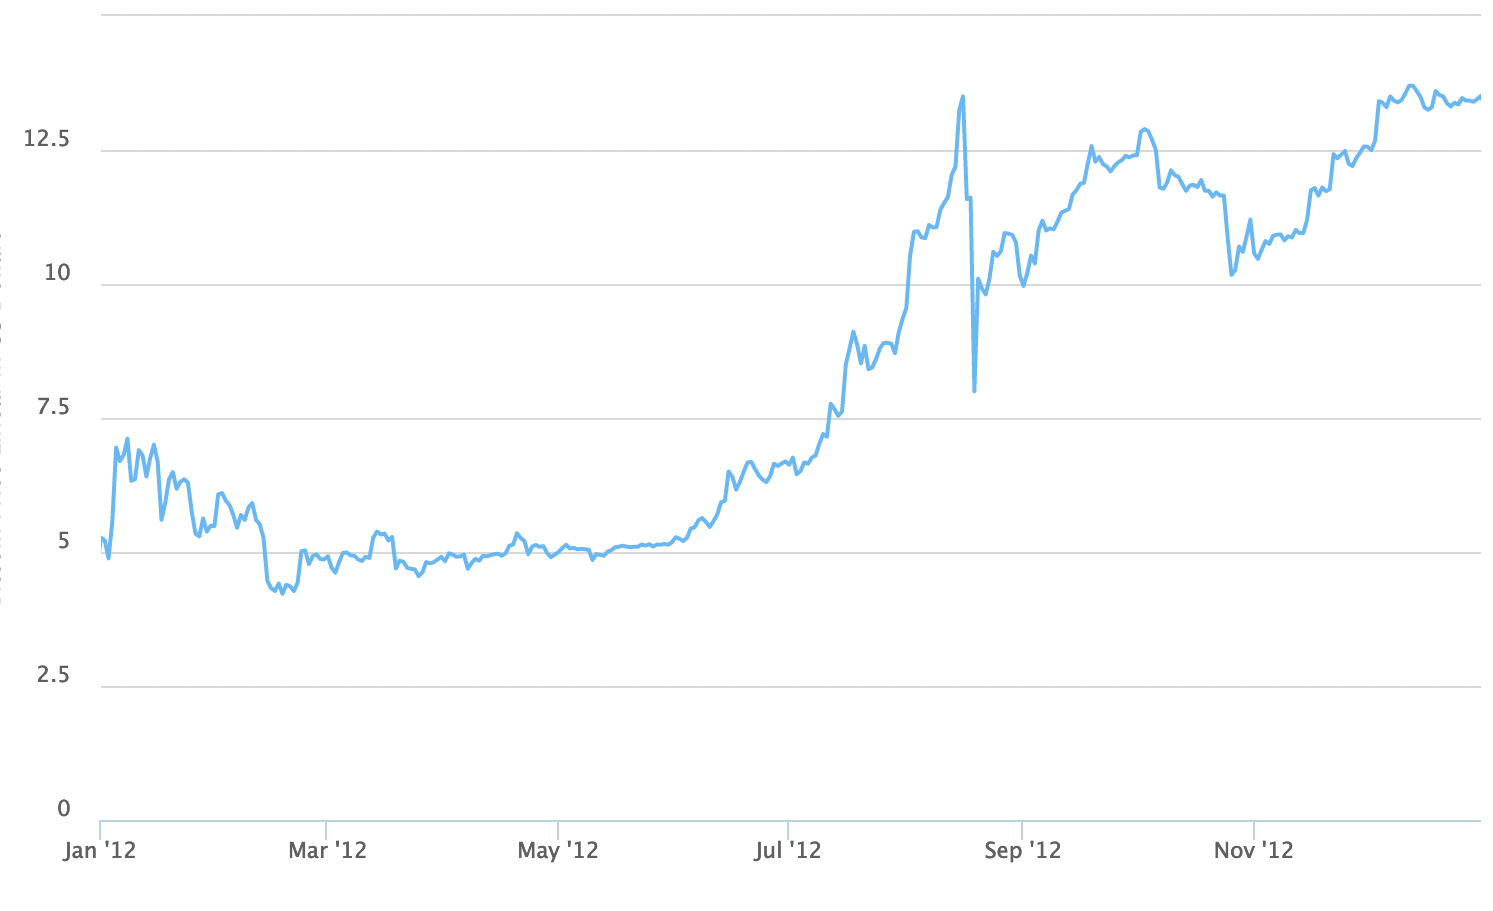
Bitcoin Price during 2012
Bitcoin had a relatively flat 2012, trading within a \$0.50 range of \$5.00 for the first half of the year.
It then reached its yearly peak at the end of December, hitting a high of \$13.45.
In November 2012, Bitcoin underwent its first ever [halving](https://bitbo.io/halving/). This dropped the block reward from 50 BTC to 25 BTC.
2012 also saw the creation of the influential Bitcoin Foundation by Gavin Andresen, Jon Matonis, Patrick Murck, Charlie Shrem, and Peter Vessenes. The Foundation's goal is to "accelerate the global growth of Bitcoin through standardization, protection, and promotion of the open source protocol".
Wordpress became the first major company to begin in 2012[(2)](https://charts.bitbo.io/price/#article-sources). The online content management system provider did this in response to PayPal's censorship.
PayPal alone blocks access from over 60 countries, and many credit card companies have similar restrictions. Some are blocked for political reasons, some because of higher fraud rates, and some for other financial reasons. Whatever the reason, we don't think an individual blogger from Haiti, Ethiopia, or Kenya should have diminished access to the blogosphere because of payment issues they can't control. Our goal is to enable people, not block them.
Wordpress[(3)](https://charts.bitbo.io/price/#article-sources)
Though Wordpress's move was a big one for the four year-old cryptocurrency, the company wasn't handling Bitcoin transactions itself. Rather, it used BitPay, which was founded in 2011 and by October 2012 had grown to processing Bitcoin payments for more than 1,000 merchants.
## How Much was 1 Bitcoin Worth in 2013?
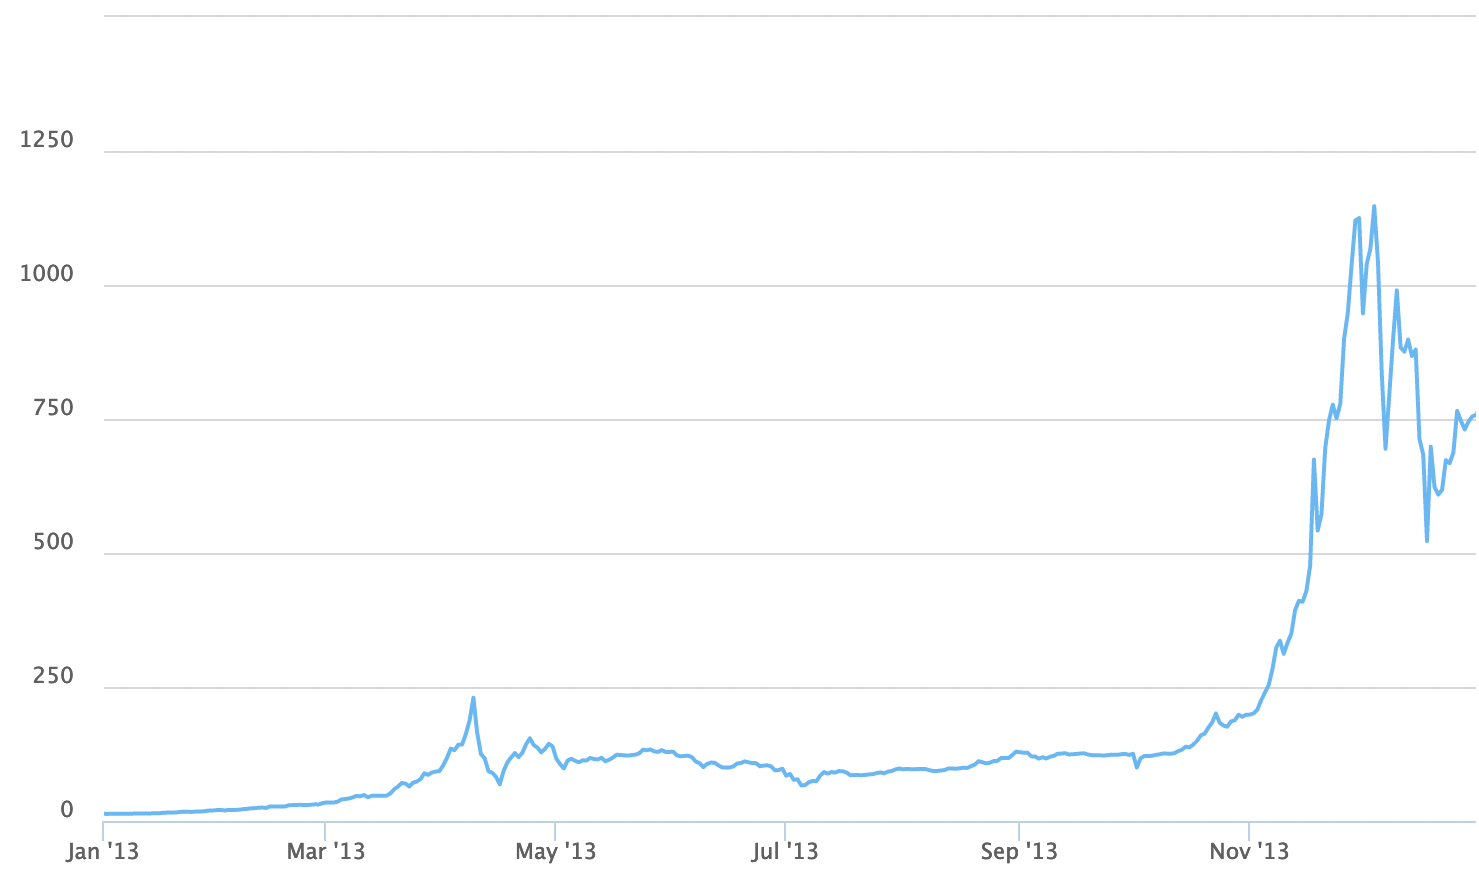
Bitcoin Price during 2013
2013 saw the first major spike in the price of Bitcoin since 2011. From \$13.00 at the beginning of the year, Bitcoin hit nearly \$250 in April. It then cooled off for a while, before experiencing another rapid appreciation to over \$1,100 in December of that year.
Bitcoin punched through \$100 easily, though \$1,000 proved to be a tougher psychological resistance level. Despite reaching prices that early Bitcoiners had only ever dreamed about, it took more than three years for the price to reach \$1,000 again. The drawdown reached -85% at its bottom and the price of Bitcoin was relatively flat for years.
Bitcoin's record-breaking run pushed the cryptocurrency's market capitalization over \$1 billion for the first time ever. It also attracted a lot of attention. In February of 2013, Coinbase reported selling more than \$1 million worth of Bitcoin at an average price of \$22.
The world's first Bitcoin ATM was installed in Vancouver, allowing people to turn their cash into crypto.
The internet's first cryptocurrency also gained some notoriety after the People's Bank of China prohibited Chinese financial institutions from transacting in Bitcoins. This came in December 2013 and led to the shutdown of BTC China - at that time the world's largest Bitcoin exchanges - and a sudden drop in price.
## How Much was 1 Bitcoin Worth in 2014?
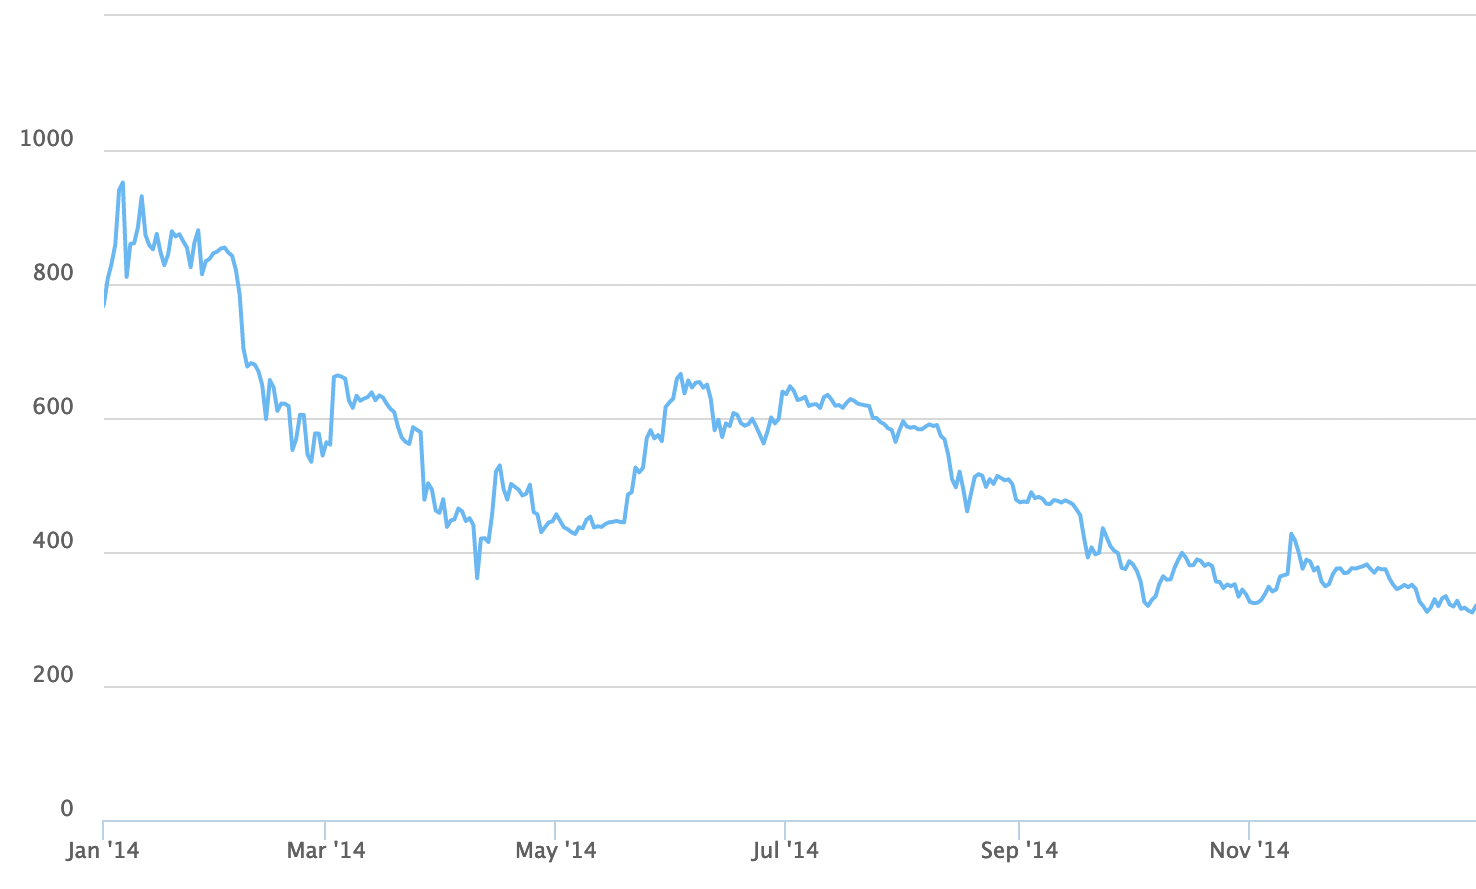
Bitcoin Price during 2014
2014 got off to a good start, but things quickly turned sour for Bitcoin.
Just one month after it closed, BTC China reopened for trading and Chinese Yuan deposits in January 2014.
However, in February Mt. Gox – still one of the largest and most important crypto exchanges – suspended withdrawals. Users had been reporting issues with withdrawals for months, but the exchange called it quits once and for all and filed for bankruptcy. It also reported that it had lost 744,000 BTC of user funds.
The price of Bitcoin reacted by selling off more than 55% from the beginning of February to April.
Despite the bear market, a number of big companies announced their support for Bitcoin. Overstock.com began accepting Bitcoin for all purchases on its website, as did Microsoft in the Xbox and Windows stores.
[ 100+ free Bitcoin charts and indicators. charts.bitbo.io/index](https://charts.bitbo.io/index/)
[ View the Bitcoin Fear & Greed Index live. charts.bitbo.io/fear-greed](https://charts.bitbo.io/fear-greed/)
## How Much was 1 Bitcoin Worth in 2015?
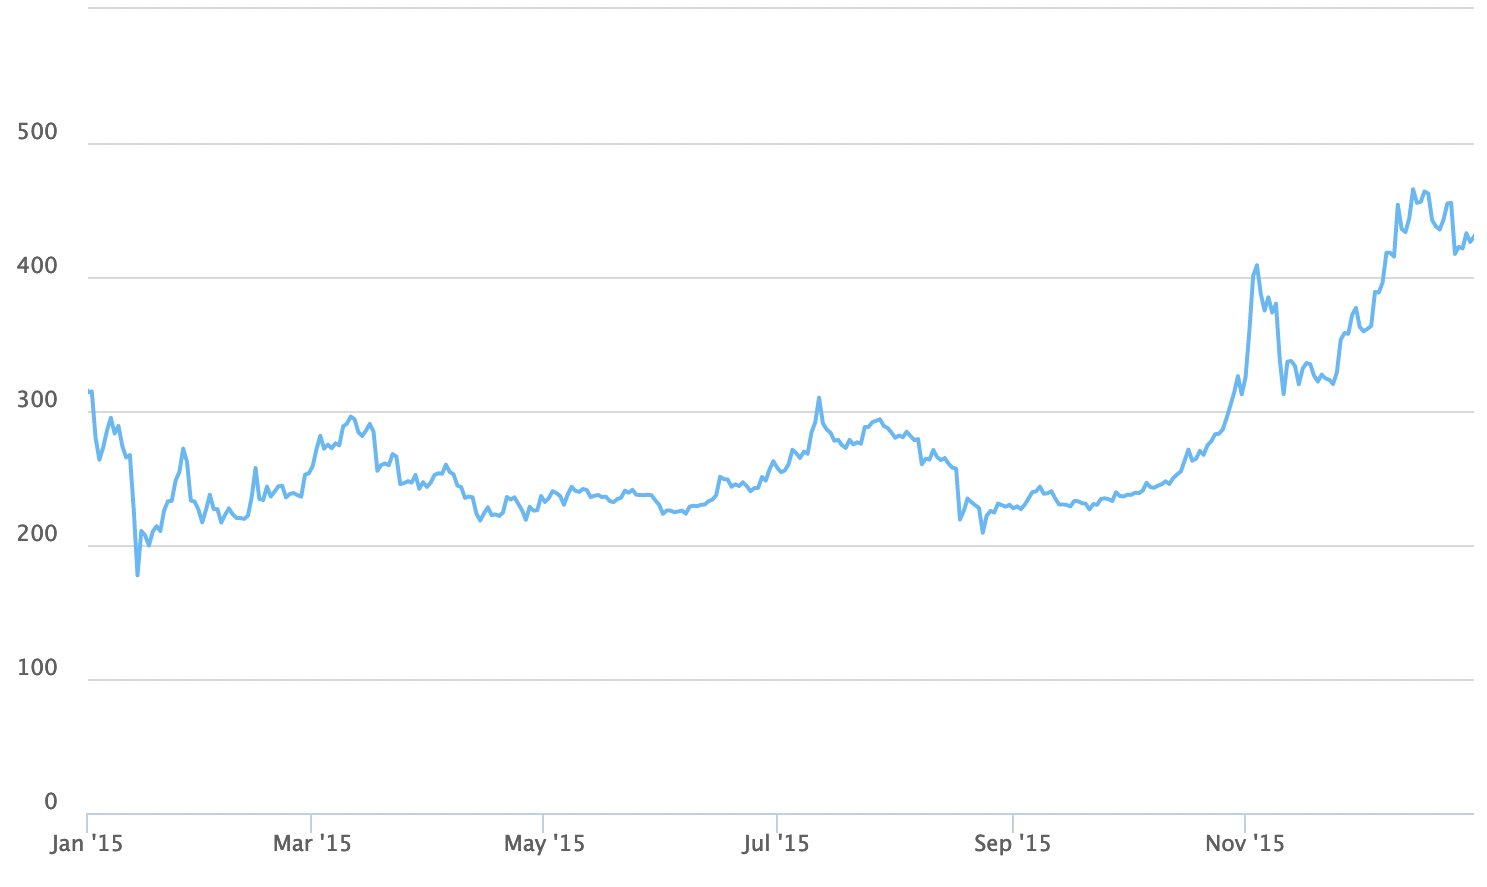
Bitcoin Price during 2015
The price of Bitcoin in 2015 started off weakly, with a -50% selloff in the first two weeks of the year. This included a -24% drop in just one day on the 14th of January. This may have been inspired by the announcement from prominent European exchange Bitstamp that they had lost 19,000 BTC in a hack. Coinbase had better news, though, as the exchange raised \$75 million in its Series C funding round.
\$150 marked the local bottom for the year, though. In fact, January 2015 was the last time you could ever buy 1 BTC for \$150. The price of Bitcoin topped \$500 for the first time in over a year later in 2015.
In June, the New York State Department of Financial Services began its investigation into Bitcoin and cryptocurrencies. This investigation would eventually lead to the creation of the BitLicense.
In November, the Unicode Committee adopted the current Bitcoin currency symbol (*₿*), giving the internet's first widespread native currency its own character.
## How Much was 1 Bitcoin Worth in 2016?
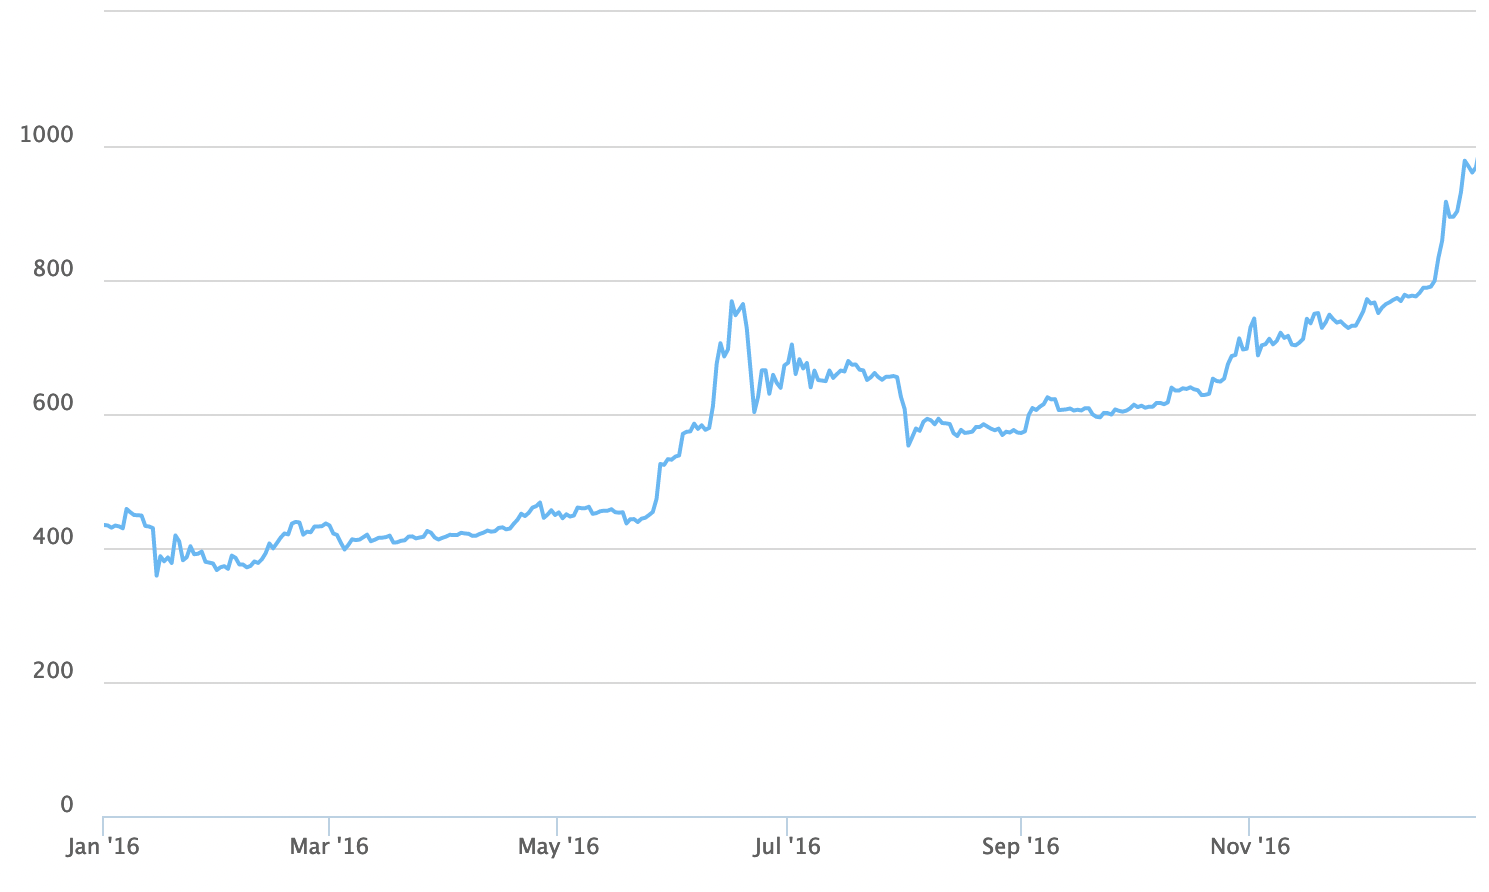
Bitcoin Price during 2016
2016 saw the Bitcoin network's hash rate top 1 exahash/second. The hash rate reflects the amount of computing power committed to Bitcoin and is an important measure of the strength of the network.
The price of Bitcoin continued its slow but steady appreciation over the course of the year. After a spike to \$750 in June, Bitcoin retraced before closing the year just shy of the all-important \$1,000 mark.
## How Much was 1 Bitcoin Worth in 2017?
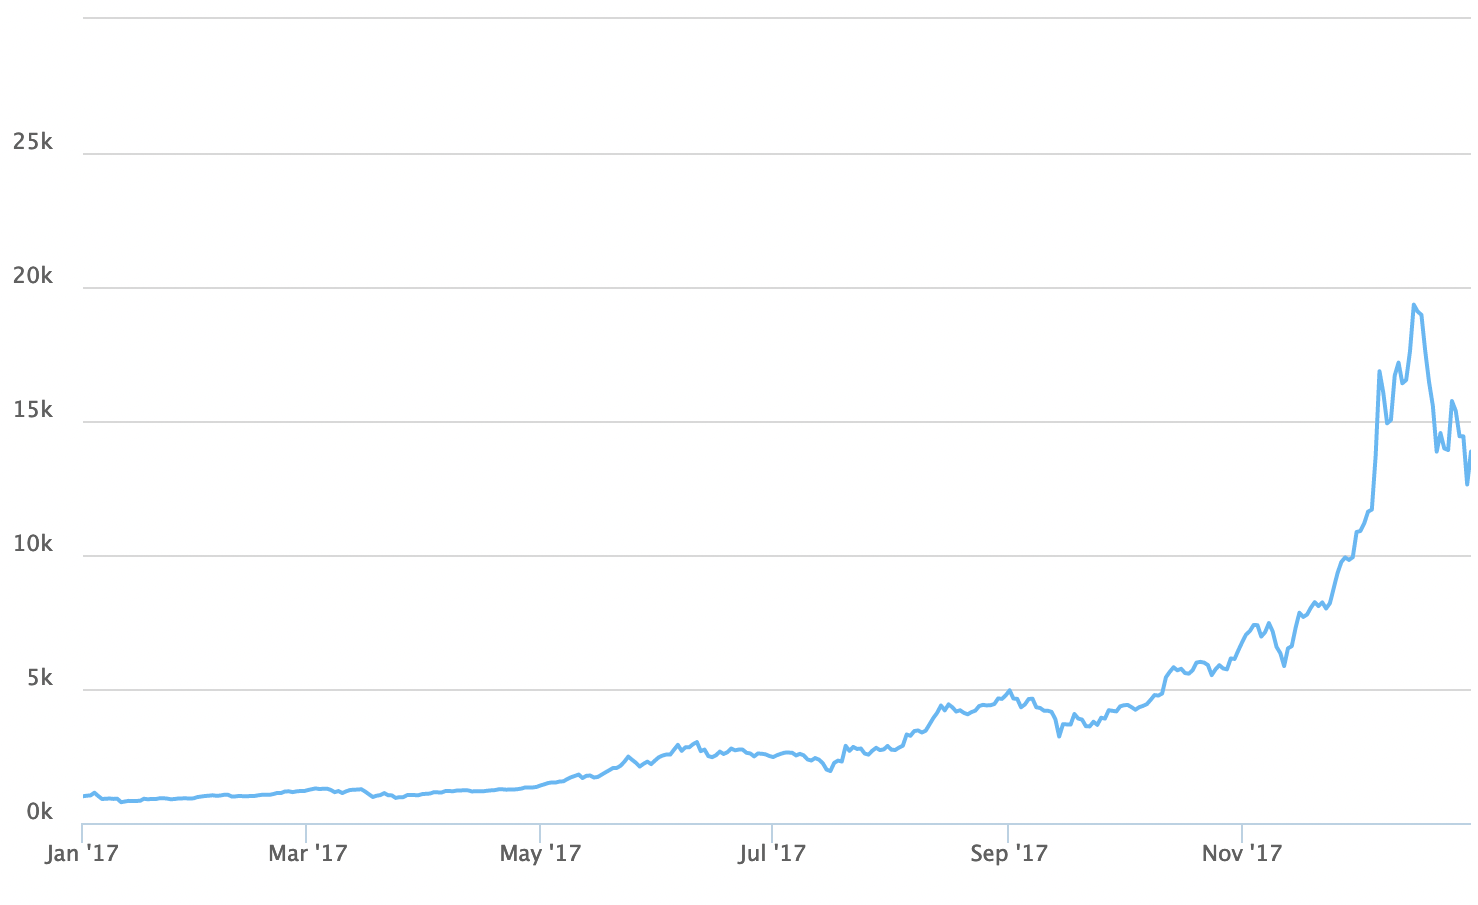
Bitcoin Price during 2017
2017 is a year that lives in crypto history. As you can see in the chart above, the year saw a steady appreciation in the price of Bitcoin followed by a huge blow-off top to nearly \$20,000.
This 1,300% increase in price wasn't the largest yearly growth – that title belongs to 2013 with its 6,600% gains – but it was the first time that Bitcoin truly broke into the mainstream of public opinion.
A \$19,000 Bitcoin is impossible to ignore.
Bitcoin once again broke the \$1,000 resistance on January 1st for the first time in three years, and after the 28th of March it never revisited that level.
The massive appreciation in price over the course of 2017 was driven in part by strong retail interest in the cryptocurrency. Trading volume on Bitso - Mexico's leading exchange - grew 1,500% in the six months ending March 2017. Poloniex experienced 600% growth in the number of active traders on its platform throughout the year.
Despite the huge increase in price and subsequent attention paid to Bitcoin, 2017 was not without difficulty for the cryptocurrency. This was the year of one of the most contentious and hotly-debated events in Bitcoin history: the Bitcoin Cash hard fork.
While many were concerned about the effects of this fork on Bitcoin, with the benefit of four years' hindsight its safe to say that Bitcoin Cash lost the war it started. Today, its market capitalization is less than 1% of Bitcoin's.
On December 11, Bitcoin futures trading opened at the Chicago Board Options Exchange, the largest U.S. options exchange. Bitcoin rallied 12% that day, though its stellar run came to an end just five days later. The high of \$19,000 would not be broken for almost three more years.
## How Much was 1 Bitcoin Worth in 2018?
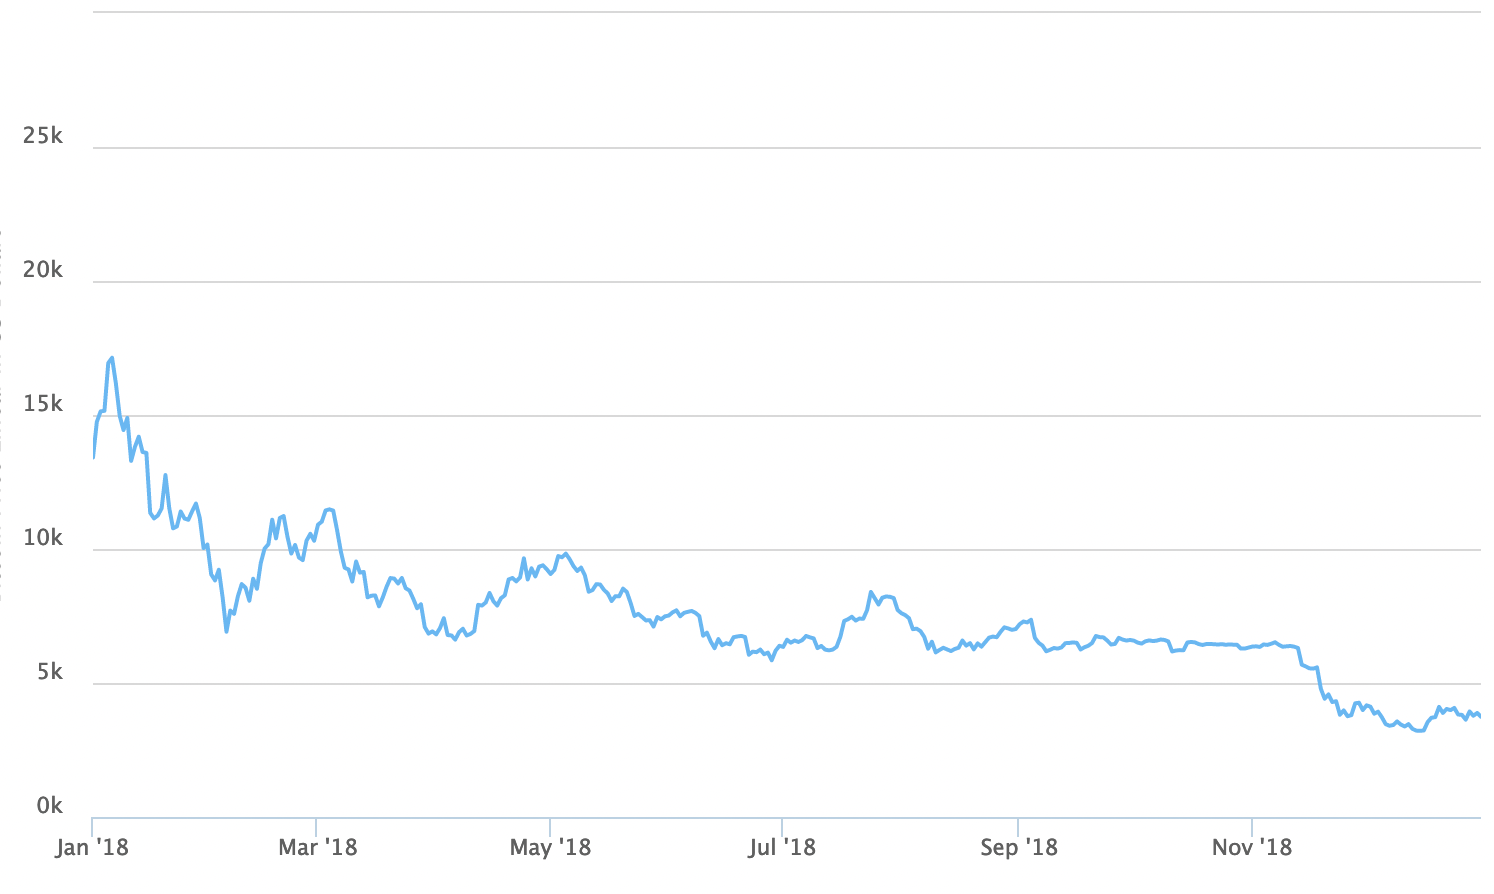
Bitcoin Price during 2018
2018 was a tough year for many in Bitcoin, both seasoned investors and those new to the space who had been attracted by the hype of 2017.
Bitcoin's year-on-year (YoY) return for 2018 was a painful -73%.
Google, Twitter and Facebook all passed bans on Bitcoin and cryptocurrency advertisements on their platforms, with the latter claiming that they were "frequently associated with misleading or deceptive promotional practices."
Bitcoin closed 2018 at \$3,693 – more than \$10,000 down from where it ended the previous year.
The good news for investors (though they wouldn't know it just yet) was that the bottom of Bitcoin's bear market had come on December 15, when the price hit \$3,122.
## How Much was 1 Bitcoin Worth in 2019?
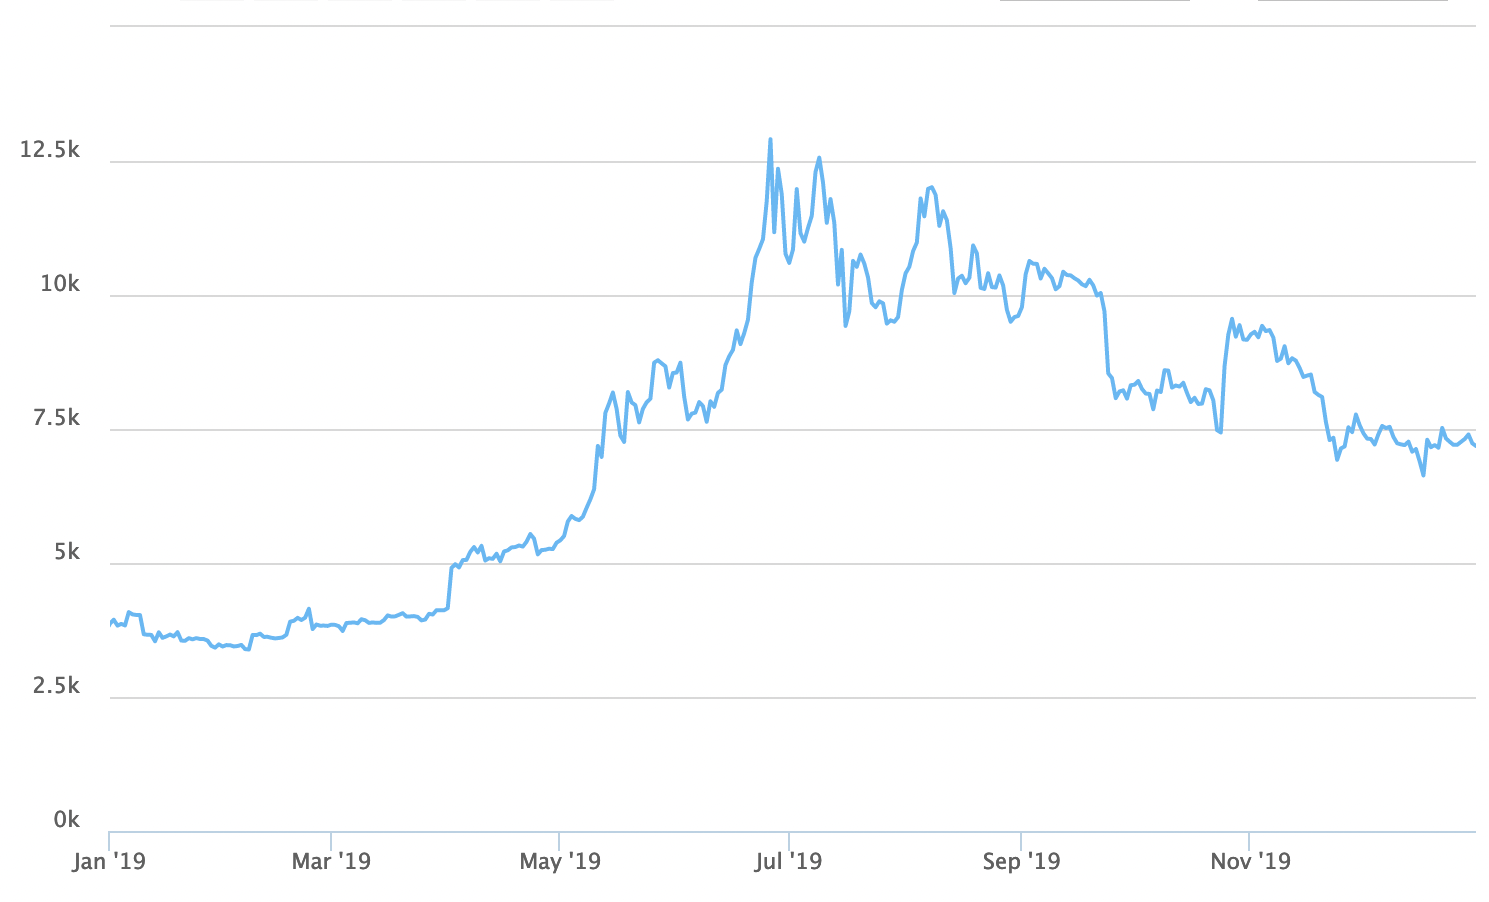
Bitcoin Price during 2019
2019 was a rollercoaster ride for Bitcoin hodlers. Starting the year under \$4,000, the price of Bitcoin rose nearly \$10,000 to hit \$13,880 by the middle of the year.
Yet these gains did not prove to be sustainable. Bitcoin bled out over the next six months, a handful of pumps notwithstanding, and ended up closing the year around \$7,160.
Still, the bounce from \$3,500 to \$13,500 proved that Bitcoin was not dead, despite the naysayers of the 2018 bear market.
2019 set the stage for what would prove to be one of the most extreme years in Bitcoin's history: 2020.
## How Much was 1 Bitcoin Worth in 2020?
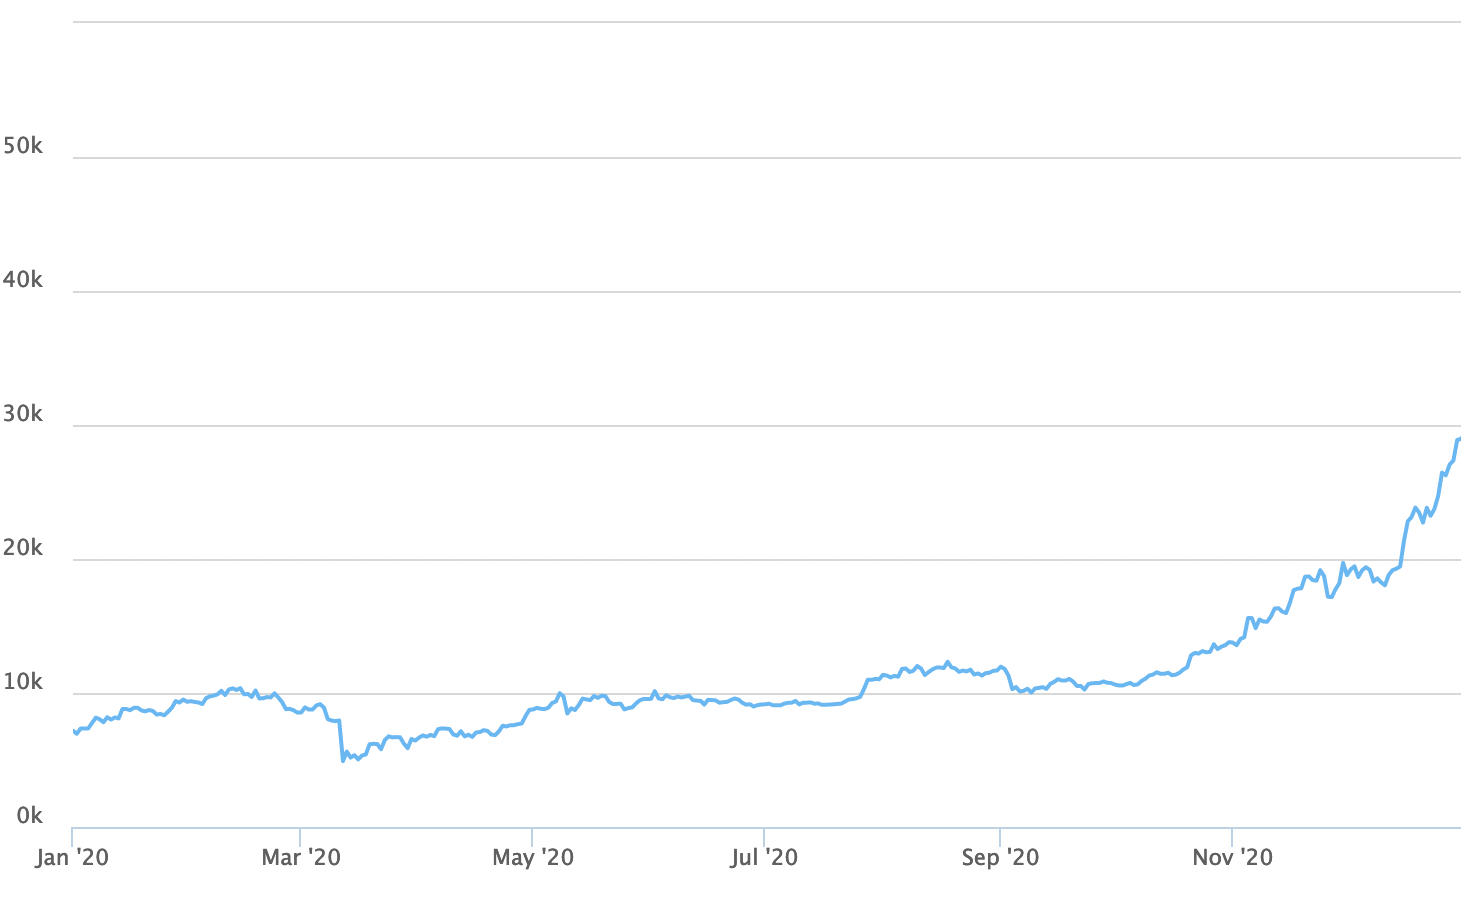
Bitcoin Price during 2020
Bitcoin rose strongly from \$7,000 at the beginning of the year to more than \$10,000 in mid-February.
\$10,000 proved to be a critical level for Bitcoin throughout the year, though it would take until October for the price to leave the \$10,000s once and for all.
First came the March crash. Triggered by the Covid-19 pandemic, a global liquidity event, and exchange liquidation engines run amok, Bitcoin sold off nearly 40% on March 12. It hit a low of \$3,850 before doubling in price over the next six weeks.
Bitcoin then entered a months-long accumulation pattern, before charging above \$10,000 in late July. It hit a high of over \$12,000 before dumping back to below \$10,000 in early September.
This proved to be the final fakeout, though. From September to the end of the year, the price of Bitcoin rallied 185% to close at just under \$29,000. This was more than \$10,000 above the previous all time high set in 2017.
From the agonizing March crash to the parabolic move into the end of the year, 2020 was a year of extreme highs and lows for Bitcoin.
This was driven in part by institutional investment. [MicroStrategy's purchase of more than \$1 billion worth of Bitcoin](https://bitbo.io/treasuries/microstrategy/) at an average price of \$15,964 over the course of 2020 made headlines. So did the Massachusetts Mutual Life Insurance Company, spending more than \$100 million on Bitcoin. This was a watershed moment for the cryptocurrency, as insurance companies are known to be conservative in their investments.
2020 proved that Bitcoin can bounce back strongly from major global events. In fact, it may even be stronger as a result. Many investors are looking to Bitcoin as a safe store of value in the face of unprecedented money printing in many countries.
While it's impossible to tell the future, one thing is for sure: 2021 is shaping up to be just as important a year in the history of Bitcoin.
## How Much was 1 Bitcoin Worth in 2021?
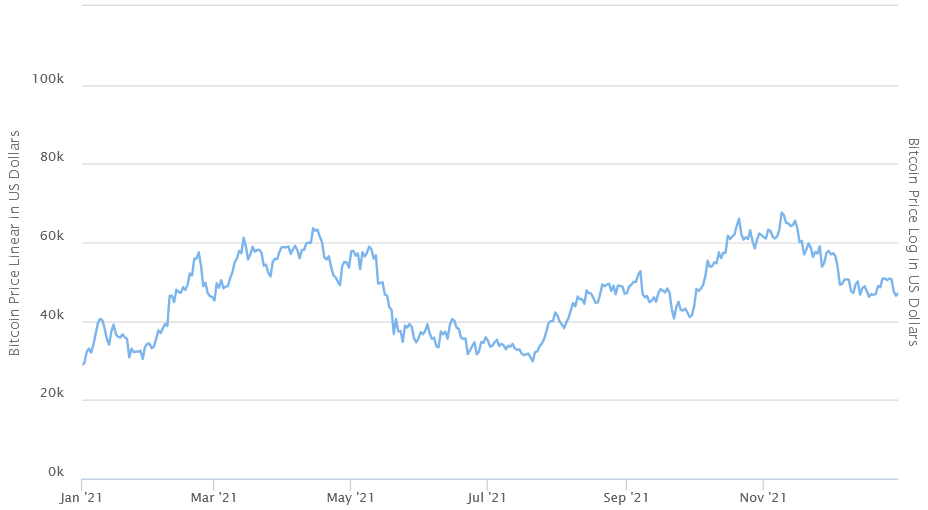
Bitcoin Price during 2021
Starting the year just below the \$30,000 mark, Bitcoin experienced a significant rally in the first half, reaching its peak close to \$60,000 around April.
However, post-April, the cryptocurrency faced a decline, stabilizing around the \$40,000 mark by July.
The remainder of the year showcased a consistent upward trajectory, with a few fluctuations but maintaining its value above the \$50,000 mark for a significant duration.
The year ended with Bitcoin slightly retracing from its high but still showcasing an overall upward trend from the start of the year.
## How Much was 1 Bitcoin Worth in 2022?
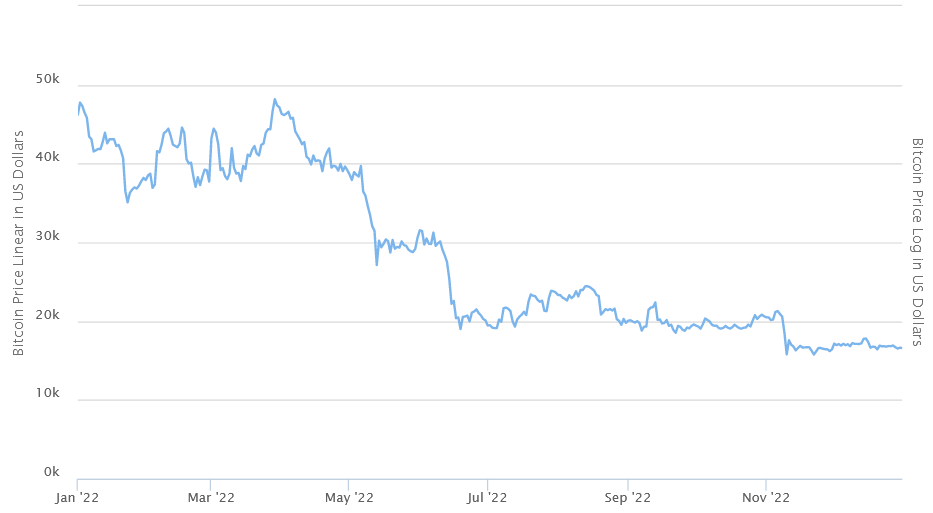
Bitcoin Price during 2022
The year 2022 saw a tumultuous start for Bitcoin. Beginning near the \$50,000 mark in January, it experienced a steady decline through the initial months, reaching its lowest point around the \$30,000 range in May.
After May, the cryptocurrency did not recover significantly past this point. The price stabilized, hovering between \$20,000 to \$30,000 for the rest of the year.
There were moments of slight upward movements, but they were met with subsequent declines, maintaining Bitcoin's price within this bracket. The year witnessed a notable constriction in its price volatility, especially when contrasted with previous years.
## How Much is Bitcoin Worth in Gold
You can check the Bitcoin price in gold, by [clicking here](https://charts.bitbo.io/btc-gold/).
[ 100+ free Bitcoin charts and indicators. charts.bitbo.io/index](https://charts.bitbo.io/index/)
[ View the Bitcoin Fear & Greed Index live. charts.bitbo.io/fear-greed](https://charts.bitbo.io/fear-greed/)
## FAQ
## How Much Was Bitcoin When it First Came Out?
Bitcoin did not have a price when it first came out.
Bitcoin was much different than the ICOs we've come to know in nowadays.
Bitcoin was just a passion project created by Satoshi Nakamoto and his online cypherpunk friends.
Everyone back then acquired Bitcoins by mining them on their personal computer and trading them with each other just to see if they could.
It really wasn't until Laszlo Hanyecz made the first Bitcoin trade for real goods (two Papa John's pizzas in exchange for 10,000 Bitcoins) that there was really even a price applied to Bitcoin at all.
## What was The Bitcoin Price 10 Years Ago?
Bitcoin hit \$1 for the first time ever on February 9th, 2011. On that day, forums posts began to emerge suggesting Bitcoiners around the world ought to throw "parity parties" (meaning a party celebrating Bitcoin's parity with the US Dollar).
## What Was Bitcoin's Lowest Price Ever?
Technically, the lowest Bitcoin price ever was \$0.00. That's because for many years, Bitcoins weren't worth anything.
Bitcoins lowest price after its all time high in 2017 was around \$3,350.
## How Much is a Share of Bitcoin
We don't really call anything in Bitcoin a "share". This is a term we generally use for stocks issued on a stock exchange. Bitcoin doesn't really work that way. All there is is the Bitcoin Price.
Currently the price of a Bitcoin (or a "share of Bitcoin", if you'd like) is displayed at the top of this page and is updated regularly.
## Why did Bitcoin Break its All Time High on February 23, 2017?
Before February 23, 2017, Bitcoin had experienced 2 years of downwards price action followed by about 2 years of upwards movement. Once it got close to its previous high, it busted through and continued to run up throughout all of 2017.
## Why did Bitcoin Break its All Time High on November 5, 2013?
This was a wave driven by hype and greed. People had heard about Bitcoin throughout 2013, but never acted. On its second run, many people finally took the dive and started to get interested.
## Why did Bitcoin Break its All Time High on February 20, 2013
Many believe that Cyprus's financial crisis[(4)](https://charts.bitbo.io/price/#article-sources) helped create new demand for bitcoins.
## When Will Bitcoin Hit a New All Time High Again?
Nobody knows for sure! One trend to notice is that [Bitcoin's supply halving](https://bitbo.io/halving/) have often preceded its historic runs.
## Will Bitcoin Ever Hit a New High Again?
Again, nobody knows for sure\!
Bitcoin's price has always moved in cycles. It's hard to say if that trend will continue or if the cycles will be different than in years past.
### More Charts
[ Bitcoin Rainbow Chart A Bitcoin rainbow chart using only the halving dates as data.](https://charts.bitbo.io/rainbow/)
[ Bitcoin Fear and Greed Index A sentiment analysis tool for Bitcoin and crypto markets, indicating when markets are overly fearful or greedy.](https://charts.bitbo.io/fear-greed/)
[ Bitcoin Price Predictions Shows 4 Bitcoin price models: power law, stock to flow, stock to income, and HPR Rainbow.](https://charts.bitbo.io/price-prediction/)
### Get Alerts When We Launch New Charts
[Telegram](https://t.me/BitboBTC) [Email](https://newcharts.bitbo.io/subscribe) [X / Twitter](https://twitter.com/BitboBTC)
[ Best sites to buy BTC with the lowest fees in the USA. bitbo.io/buy/usa](https://bitbo.io/buy/usa/)
[ Access our API for on-chain metrics, technical indicators, & more. charts.bitbo.io/btc-api](https://charts.bitbo.io/btc-api)
[ Unlock 50+ private charts with Bitbo Pro. charts.bitbo.io/private](https://charts.bitbo.io/private/)
×
Bitbo's charts section offers a wide range of Bitcoin charts and metrics.
If you have any questions, comments, or feedback please reach out to us via Twitter or via email at info@bitbo.io.
[@ BitboBTC](https://twitter.com/BitboBTC)
About
[Pricing](https://charts.bitbo.io/pricing/) [Buy](https://bitbo.io/buy/)
[Terms of Service](https://charts.bitbo.io/terms/) [Privacy Policy](https://charts.bitbo.io/privacy-policy/) [Refunds & Payments](https://charts.bitbo.io/refunds-payments/) |
| Readable Markdown | ## How Much is Bitcoin Worth Today?
Bitcoin is currently worth \$71,585.94 as of the time you loaded this page.
Check [what would have happened if you would have bought Bitcoin.](https://charts.bitbo.io/if-i-bought/)
## How Much was 1 Bitcoin Worth in 2009?
In the very early days of Bitcoin, there were no exchanges that look anything like the offerings today. But there was at least one exchange established in the first year since Bitcoin's inception.
The BitcoinTalk forum went online in late 2009 and soon enough one regular proposed the idea of an exchange where people could buy and sell Bitcoins for fiat currency. Keep in mind that this was when the block reward was 50 BTC and there were very few people mining.
The BitcoinTalk forum member *NewLibertyStandard* set up New Liberty Standard Exchange, and another forum user - *Sirius* - sent him 5050 BTC in exchange for \$5.02 through PayPal. This puts the first recorded price at which Bitcoin exchanged hands at \$0.00099/BTC.
## How Much was 1 Bitcoin Worth in 2010?
Bitcoin's price never topped \$1 in 2010! Its highest price for the year was just \$0.39\!
2010 is the year in which the famous purchase of two Dominos pizzas for 10,000 BTC took place.
BitcoinTalk forum member *laszlo* offered the following trade:
I'll pay 10,000 bitcoins for a couple of pizzas.. like maybe 2 large ones so I have some left over for the next day. I like having left over pizza to nibble on later. You can make the pizza yourself and bring it to my house or order it for me from a delivery place, but what I'm aiming for is getting food delivered in exchange for bitcoins where I don't have to order or prepare it myself, kind of like ordering a 'breakfast platter' at a hotel or something, they just bring you something to eat and you're happy\!
I like things like onions, peppers, sausage, mushrooms, tomatoes, pepperoni, etc.. just standard stuff no weird fish topping or anything like that. I also like regular cheese pizzas which may be cheaper to prepare or otherwise acquire.
If you're interested please let me know and we can work out a deal.
Thanks,
Laszlo
BitcoinTalk Forum[(1)](https://charts.bitbo.io/price/#article-sources)
2010 also saw the opening of the infamous Bitcoin exchange Mt. Gox in July.
## How Much was 1 Bitcoin Worth in 2011?

Bitcoin Price during 2011
Bitcoin's adoption started to pick up steam in 2011. The Electronic Frontier Foundation (EFF) accepted Bitcoins as donations for a couple of months in 2011. Due to lack of legal precedent surrounding virtual currencies this arrangement was quickly rescinded, though this was later reversed in 2013 when the EFF began accepting Bitcoin again.
On February 9th, 2011, BTC reached a value of USD\$1.00 for the first time ever. A few months later, in June, the price of one Bitcoin hit \$10, then \$30 on Mt. Gox. This represented a 100x appreciation since the beginning of the year, when the price of Bitcoin hovered around \$0.30.
By the end of the year Bitcoin was trading just under \$5, but at least two important psychological barriers had been broken.
## How Much was 1 Bitcoin Worth in 2012?

Bitcoin Price during 2012
Bitcoin had a relatively flat 2012, trading within a \$0.50 range of \$5.00 for the first half of the year.
It then reached its yearly peak at the end of December, hitting a high of \$13.45.
In November 2012, Bitcoin underwent its first ever [halving](https://bitbo.io/halving/). This dropped the block reward from 50 BTC to 25 BTC.
2012 also saw the creation of the influential Bitcoin Foundation by Gavin Andresen, Jon Matonis, Patrick Murck, Charlie Shrem, and Peter Vessenes. The Foundation's goal is to "accelerate the global growth of Bitcoin through standardization, protection, and promotion of the open source protocol".
Wordpress became the first major company to begin in 2012[(2)](https://charts.bitbo.io/price/#article-sources). The online content management system provider did this in response to PayPal's censorship.
PayPal alone blocks access from over 60 countries, and many credit card companies have similar restrictions. Some are blocked for political reasons, some because of higher fraud rates, and some for other financial reasons. Whatever the reason, we don't think an individual blogger from Haiti, Ethiopia, or Kenya should have diminished access to the blogosphere because of payment issues they can't control. Our goal is to enable people, not block them.
Wordpress[(3)](https://charts.bitbo.io/price/#article-sources)
Though Wordpress's move was a big one for the four year-old cryptocurrency, the company wasn't handling Bitcoin transactions itself. Rather, it used BitPay, which was founded in 2011 and by October 2012 had grown to processing Bitcoin payments for more than 1,000 merchants.
## How Much was 1 Bitcoin Worth in 2013?

Bitcoin Price during 2013
2013 saw the first major spike in the price of Bitcoin since 2011. From \$13.00 at the beginning of the year, Bitcoin hit nearly \$250 in April. It then cooled off for a while, before experiencing another rapid appreciation to over \$1,100 in December of that year.
Bitcoin punched through \$100 easily, though \$1,000 proved to be a tougher psychological resistance level. Despite reaching prices that early Bitcoiners had only ever dreamed about, it took more than three years for the price to reach \$1,000 again. The drawdown reached -85% at its bottom and the price of Bitcoin was relatively flat for years.
Bitcoin's record-breaking run pushed the cryptocurrency's market capitalization over \$1 billion for the first time ever. It also attracted a lot of attention. In February of 2013, Coinbase reported selling more than \$1 million worth of Bitcoin at an average price of \$22.
The world's first Bitcoin ATM was installed in Vancouver, allowing people to turn their cash into crypto.
The internet's first cryptocurrency also gained some notoriety after the People's Bank of China prohibited Chinese financial institutions from transacting in Bitcoins. This came in December 2013 and led to the shutdown of BTC China - at that time the world's largest Bitcoin exchanges - and a sudden drop in price.
## How Much was 1 Bitcoin Worth in 2014?

Bitcoin Price during 2014
2014 got off to a good start, but things quickly turned sour for Bitcoin.
Just one month after it closed, BTC China reopened for trading and Chinese Yuan deposits in January 2014.
However, in February Mt. Gox – still one of the largest and most important crypto exchanges – suspended withdrawals. Users had been reporting issues with withdrawals for months, but the exchange called it quits once and for all and filed for bankruptcy. It also reported that it had lost 744,000 BTC of user funds.
The price of Bitcoin reacted by selling off more than 55% from the beginning of February to April.
Despite the bear market, a number of big companies announced their support for Bitcoin. Overstock.com began accepting Bitcoin for all purchases on its website, as did Microsoft in the Xbox and Windows stores.
## How Much was 1 Bitcoin Worth in 2015?

Bitcoin Price during 2015
The price of Bitcoin in 2015 started off weakly, with a -50% selloff in the first two weeks of the year. This included a -24% drop in just one day on the 14th of January. This may have been inspired by the announcement from prominent European exchange Bitstamp that they had lost 19,000 BTC in a hack. Coinbase had better news, though, as the exchange raised \$75 million in its Series C funding round.
\$150 marked the local bottom for the year, though. In fact, January 2015 was the last time you could ever buy 1 BTC for \$150. The price of Bitcoin topped \$500 for the first time in over a year later in 2015.
In June, the New York State Department of Financial Services began its investigation into Bitcoin and cryptocurrencies. This investigation would eventually lead to the creation of the BitLicense.
In November, the Unicode Committee adopted the current Bitcoin currency symbol (*₿*), giving the internet's first widespread native currency its own character.
## How Much was 1 Bitcoin Worth in 2016?

Bitcoin Price during 2016
2016 saw the Bitcoin network's hash rate top 1 exahash/second. The hash rate reflects the amount of computing power committed to Bitcoin and is an important measure of the strength of the network.
The price of Bitcoin continued its slow but steady appreciation over the course of the year. After a spike to \$750 in June, Bitcoin retraced before closing the year just shy of the all-important \$1,000 mark.
## How Much was 1 Bitcoin Worth in 2017?

Bitcoin Price during 2017
2017 is a year that lives in crypto history. As you can see in the chart above, the year saw a steady appreciation in the price of Bitcoin followed by a huge blow-off top to nearly \$20,000.
This 1,300% increase in price wasn't the largest yearly growth – that title belongs to 2013 with its 6,600% gains – but it was the first time that Bitcoin truly broke into the mainstream of public opinion.
A \$19,000 Bitcoin is impossible to ignore.
Bitcoin once again broke the \$1,000 resistance on January 1st for the first time in three years, and after the 28th of March it never revisited that level.
The massive appreciation in price over the course of 2017 was driven in part by strong retail interest in the cryptocurrency. Trading volume on Bitso - Mexico's leading exchange - grew 1,500% in the six months ending March 2017. Poloniex experienced 600% growth in the number of active traders on its platform throughout the year.
Despite the huge increase in price and subsequent attention paid to Bitcoin, 2017 was not without difficulty for the cryptocurrency. This was the year of one of the most contentious and hotly-debated events in Bitcoin history: the Bitcoin Cash hard fork.
While many were concerned about the effects of this fork on Bitcoin, with the benefit of four years' hindsight its safe to say that Bitcoin Cash lost the war it started. Today, its market capitalization is less than 1% of Bitcoin's.
On December 11, Bitcoin futures trading opened at the Chicago Board Options Exchange, the largest U.S. options exchange. Bitcoin rallied 12% that day, though its stellar run came to an end just five days later. The high of \$19,000 would not be broken for almost three more years.
## How Much was 1 Bitcoin Worth in 2018?

Bitcoin Price during 2018
2018 was a tough year for many in Bitcoin, both seasoned investors and those new to the space who had been attracted by the hype of 2017.
Bitcoin's year-on-year (YoY) return for 2018 was a painful -73%.
Google, Twitter and Facebook all passed bans on Bitcoin and cryptocurrency advertisements on their platforms, with the latter claiming that they were "frequently associated with misleading or deceptive promotional practices."
Bitcoin closed 2018 at \$3,693 – more than \$10,000 down from where it ended the previous year.
The good news for investors (though they wouldn't know it just yet) was that the bottom of Bitcoin's bear market had come on December 15, when the price hit \$3,122.
## How Much was 1 Bitcoin Worth in 2019?

Bitcoin Price during 2019
2019 was a rollercoaster ride for Bitcoin hodlers. Starting the year under \$4,000, the price of Bitcoin rose nearly \$10,000 to hit \$13,880 by the middle of the year.
Yet these gains did not prove to be sustainable. Bitcoin bled out over the next six months, a handful of pumps notwithstanding, and ended up closing the year around \$7,160.
Still, the bounce from \$3,500 to \$13,500 proved that Bitcoin was not dead, despite the naysayers of the 2018 bear market.
2019 set the stage for what would prove to be one of the most extreme years in Bitcoin's history: 2020.
## How Much was 1 Bitcoin Worth in 2020?

Bitcoin Price during 2020
Bitcoin rose strongly from \$7,000 at the beginning of the year to more than \$10,000 in mid-February.
\$10,000 proved to be a critical level for Bitcoin throughout the year, though it would take until October for the price to leave the \$10,000s once and for all.
First came the March crash. Triggered by the Covid-19 pandemic, a global liquidity event, and exchange liquidation engines run amok, Bitcoin sold off nearly 40% on March 12. It hit a low of \$3,850 before doubling in price over the next six weeks.
Bitcoin then entered a months-long accumulation pattern, before charging above \$10,000 in late July. It hit a high of over \$12,000 before dumping back to below \$10,000 in early September.
This proved to be the final fakeout, though. From September to the end of the year, the price of Bitcoin rallied 185% to close at just under \$29,000. This was more than \$10,000 above the previous all time high set in 2017.
From the agonizing March crash to the parabolic move into the end of the year, 2020 was a year of extreme highs and lows for Bitcoin.
This was driven in part by institutional investment. [MicroStrategy's purchase of more than \$1 billion worth of Bitcoin](https://bitbo.io/treasuries/microstrategy/) at an average price of \$15,964 over the course of 2020 made headlines. So did the Massachusetts Mutual Life Insurance Company, spending more than \$100 million on Bitcoin. This was a watershed moment for the cryptocurrency, as insurance companies are known to be conservative in their investments.
2020 proved that Bitcoin can bounce back strongly from major global events. In fact, it may even be stronger as a result. Many investors are looking to Bitcoin as a safe store of value in the face of unprecedented money printing in many countries.
While it's impossible to tell the future, one thing is for sure: 2021 is shaping up to be just as important a year in the history of Bitcoin.
## How Much was 1 Bitcoin Worth in 2021?

Bitcoin Price during 2021
Starting the year just below the \$30,000 mark, Bitcoin experienced a significant rally in the first half, reaching its peak close to \$60,000 around April.
However, post-April, the cryptocurrency faced a decline, stabilizing around the \$40,000 mark by July.
The remainder of the year showcased a consistent upward trajectory, with a few fluctuations but maintaining its value above the \$50,000 mark for a significant duration.
The year ended with Bitcoin slightly retracing from its high but still showcasing an overall upward trend from the start of the year.
## How Much was 1 Bitcoin Worth in 2022?

Bitcoin Price during 2022
The year 2022 saw a tumultuous start for Bitcoin. Beginning near the \$50,000 mark in January, it experienced a steady decline through the initial months, reaching its lowest point around the \$30,000 range in May.
After May, the cryptocurrency did not recover significantly past this point. The price stabilized, hovering between \$20,000 to \$30,000 for the rest of the year.
There were moments of slight upward movements, but they were met with subsequent declines, maintaining Bitcoin's price within this bracket. The year witnessed a notable constriction in its price volatility, especially when contrasted with previous years.
## How Much is Bitcoin Worth in Gold
You can check the Bitcoin price in gold, by [clicking here](https://charts.bitbo.io/btc-gold/).
## FAQ
## How Much Was Bitcoin When it First Came Out?
Bitcoin did not have a price when it first came out.
Bitcoin was much different than the ICOs we've come to know in nowadays.
Bitcoin was just a passion project created by Satoshi Nakamoto and his online cypherpunk friends.
Everyone back then acquired Bitcoins by mining them on their personal computer and trading them with each other just to see if they could.
It really wasn't until Laszlo Hanyecz made the first Bitcoin trade for real goods (two Papa John's pizzas in exchange for 10,000 Bitcoins) that there was really even a price applied to Bitcoin at all.
## What was The Bitcoin Price 10 Years Ago?
Bitcoin hit \$1 for the first time ever on February 9th, 2011. On that day, forums posts began to emerge suggesting Bitcoiners around the world ought to throw "parity parties" (meaning a party celebrating Bitcoin's parity with the US Dollar).
## What Was Bitcoin's Lowest Price Ever?
Technically, the lowest Bitcoin price ever was \$0.00. That's because for many years, Bitcoins weren't worth anything.
Bitcoins lowest price after its all time high in 2017 was around \$3,350.
## How Much is a Share of Bitcoin
We don't really call anything in Bitcoin a "share". This is a term we generally use for stocks issued on a stock exchange. Bitcoin doesn't really work that way. All there is is the Bitcoin Price.
Currently the price of a Bitcoin (or a "share of Bitcoin", if you'd like) is displayed at the top of this page and is updated regularly.
## Why did Bitcoin Break its All Time High on February 23, 2017?
Before February 23, 2017, Bitcoin had experienced 2 years of downwards price action followed by about 2 years of upwards movement. Once it got close to its previous high, it busted through and continued to run up throughout all of 2017.
## Why did Bitcoin Break its All Time High on November 5, 2013?
This was a wave driven by hype and greed. People had heard about Bitcoin throughout 2013, but never acted. On its second run, many people finally took the dive and started to get interested.
## Why did Bitcoin Break its All Time High on February 20, 2013
Many believe that Cyprus's financial crisis[(4)](https://charts.bitbo.io/price/#article-sources) helped create new demand for bitcoins.
## When Will Bitcoin Hit a New All Time High Again?
Nobody knows for sure! One trend to notice is that [Bitcoin's supply halving](https://bitbo.io/halving/) have often preceded its historic runs.
## Will Bitcoin Ever Hit a New High Again?
Again, nobody knows for sure\!
Bitcoin's price has always moved in cycles. It's hard to say if that trend will continue or if the cycles will be different than in years past. |
| Shard | 3 (laksa) |
| Root Hash | 804083490813968403 |
| Unparsed URL | io,bitbo!charts,/price/ s443 |